

Join Our Telegram channel to stay up to date on breaking news coverage
Bitcoin (BTC) Price Prediction – September 27
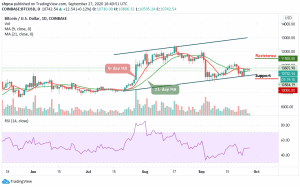
At the moment, BTC/USD is seen moving sideways above the moving averages.
BTC/USD Long-term Trend: Bullish (Daily Chart)
Key levels:
Resistance Levels: $11,500, $11,700, $11,900
Support Levels: $10,000, $9,800, $8,100
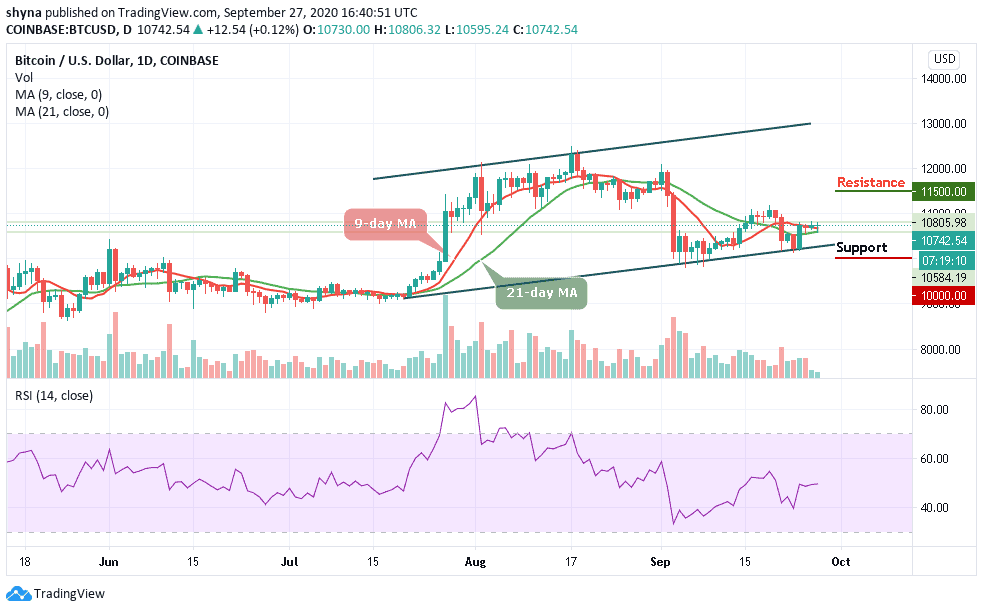
The daily chart reveals that BTC/USD failed to break the $10,800 resistance level with the current consolidation above the 9-day and 21-day moving averages. The Bitcoin (BTC) started the day off by trending lower toward the $10,500 level inside the ascending channel. The coin is also seen pulling back to where it is trading currently and may likely head downwards if the bears step back into the market.
What to Expect from Bitcoin (BTC)
On the bearish side, it is important for Bitcoin to hold the 9-day moving average within the channel and confirm it otherwise there can come a bearish breakdown when BTCUSD falls below that barrier. The technical indicator RSI (14) is seen moving sideways which is causing the market to be indecisive at the moment.
However, BTC/USD may confirm the bullish trend if the market price moves above the 9-day and 21-day moving averages while it will continue the bearish trend if the price moves below the moving averages. Meanwhile, a strong bullish spike may likely take the price to the resistance levels of $11,500, $11,700, and $11,900.
Nevertheless, if the market decides to follow the downtrend, the Bitcoin price could drop to the nearest support below the lower boundary of the channel, and should this support fails to contain sell-off, the market may experience another drop to the critical supports of $10,000, $9,800, and $9,600.
BTC/USD Medium-Term Trend: Ranging (4H Chart)
Looking at the 4-hour chart, the price of Bitcoin is currently moving around $10,722 and above the 9-day and 21-day moving averages after a reversal from $10,794. Meanwhile, the hourly chart reveals that the bullish supply is coming up slowly in the market while the bears are also trying to drag the price down.
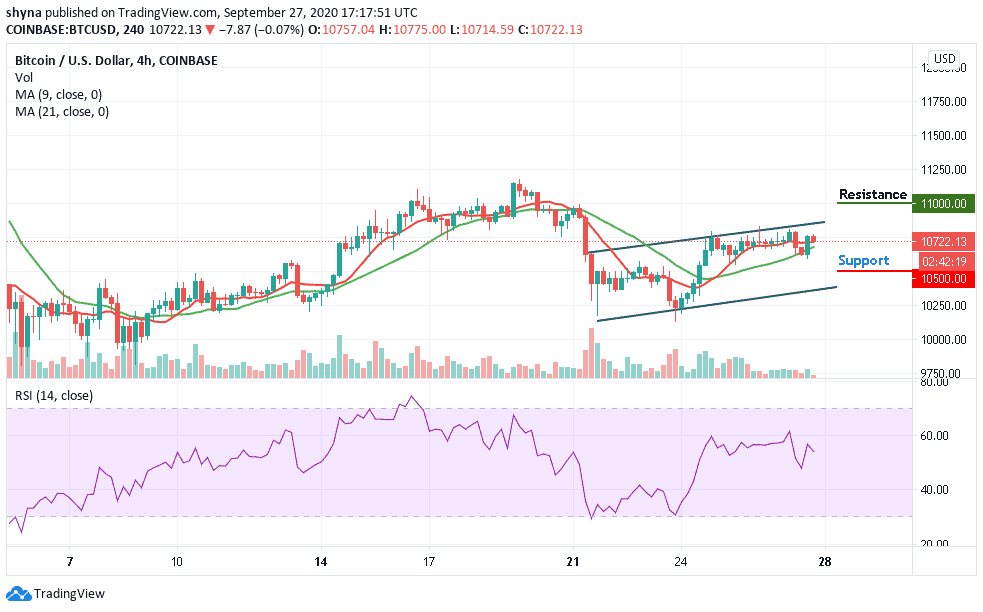
However, if the buyers could put more effort, they can further push the price to a $10,800 resistance level. Therefore, breaking the mentioned resistance could also test the $11,000 and above. More so, the RSI (14) is seen moving below 56-level, which may likely cause the sellers to step back into the market by bringing the price back to the support level of $10,500 and below.
Join Our Telegram channel to stay up to date on breaking news coverage
