Join Our Telegram channel to stay up to date on breaking news coverage
The Loopring price prediction shows that Loopring is trading near the support level of $0.200 below the 9-day and 21-day moving averages.
Loopring Prediction Statistics Data:
- Loopring price now – $0.208
- Loopring market cap – $279 million
- Loopring circulating supply – 1.33 billion
- Loopring total supply – 1.37 billion
- Loopring Coinmarketcap ranking – #93
LRC/USD Market
Key Levels:
Resistance levels: $0.320, $0.340, $0.360
Support levels: $0.100, $0.080, $0.060
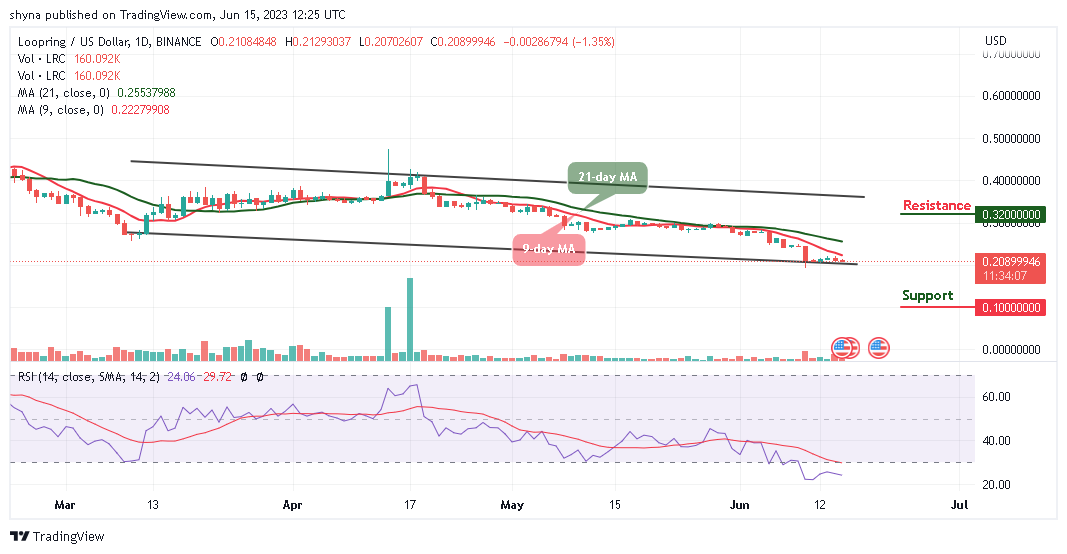
At the time of writing, LRC/USD is trading at $0.208 within the channel, indicating an indecisive movement in the market. For the time being, the market price is moving toward the resistance level of $0.215 while the trading volume confirms the sideways movement.
Loopring Price Prediction: LRC Price May Face the North
Looking at the daily chart, the Loopring price is still ranging as bulls could prepare the coin for upward movement. Meanwhile, if the buyers regroup and push the Loopring price above the 21-day moving average, the market price might revisit the resistance level of $0.250.
Therefore, any bullish movement above this level could lead the market to the crucial resistance levels at $0.320, $0.340, and $0.360 respectively. On the contrary, if the coin crosses below the lower boundary of the channel, the LRC price could reach the critical supports at $0.100, $0.080, and $0.060 as the technical indicator Relative Strength Index (14) remains within the lower boundary of the channel.
Against Bitcoin, the Loopring is trading with a slight bullish candle toward the 9-day moving average. The technical indicator Relative Strength Index (14) is moving within the oversold region which could decide the next direction of the market. Any bullish cross above the 21-day moving average may hit the resistance level of 1100 SAT and above.
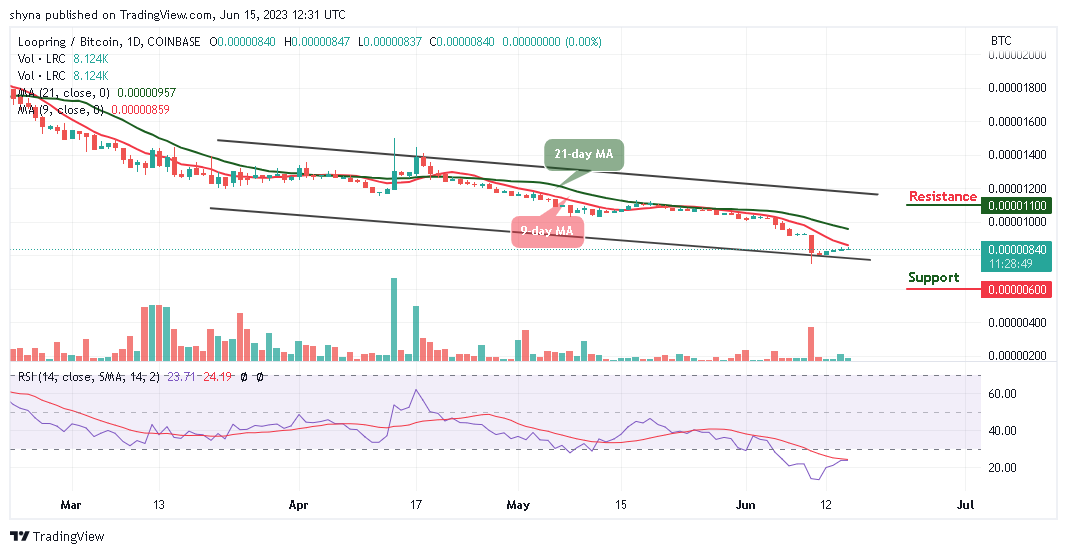
However, any form of retreat below the lower boundary of the channel could bring the coin to the support level of 600 SAT and below. But buyers will need to gather enough momentum to push the market price to the north. For now, LRC/BTC is moving bearishly and may start rising once the technical indicator turns upward.
Alternatives to Loopring
Looking at the daily chart, the next step for the Loopring price is to cross above the 21-day moving average. Once this is done, bulls may now push the coin toward the upper boundary of the channel to touch the nearest resistance level at $0.250. Therefore, since the project already has a large following, it will likely soar during the next meme coin bull run. Therefore, the Wall Street Memes token could be a great way to maximize gains while speculating on the meme coin asset class as the token has raised almost $7 million in the ongoing presale.
Read more:
- Ethereum Price Analysis: ETH/USD Faces Restraints as the Price Falls Below $210
- Litecoin Price Prediction: LTC/USD Takes the Day as Price Aims at $300 Level
- Bitcoin (BTC) Price Prediction: BTC/USD Is in a Tight Range between $34,500 and $38,000, Breakout is Imminent on the Upside
New OKX Listing - Wall Street Memes

- Established Community of Stocks & Crypto Traders
- Featured on Cointelegraph, CoinMarketCap, Yahoo Finance
- Rated Best Crypto to Buy Now In Meme Coin Sector
- Team Behind OpenSea NFT Collection - Wall St Bulls
- Tweets Replied to by Elon Musk
Join Our Telegram channel to stay up to date on breaking news coverage