Join Our Telegram channel to stay up to date on breaking news coverage
LTC Price Prediction – February 1
Today, Litecoin (LTC) happens to be the best-performing coin among the top-10 cryptocurrencies and the further recovery may be capped by $72.
LTC/USD Market
Key Levels:
Resistance levels: $78, $80, $82
Support levels: $62, $60, $58
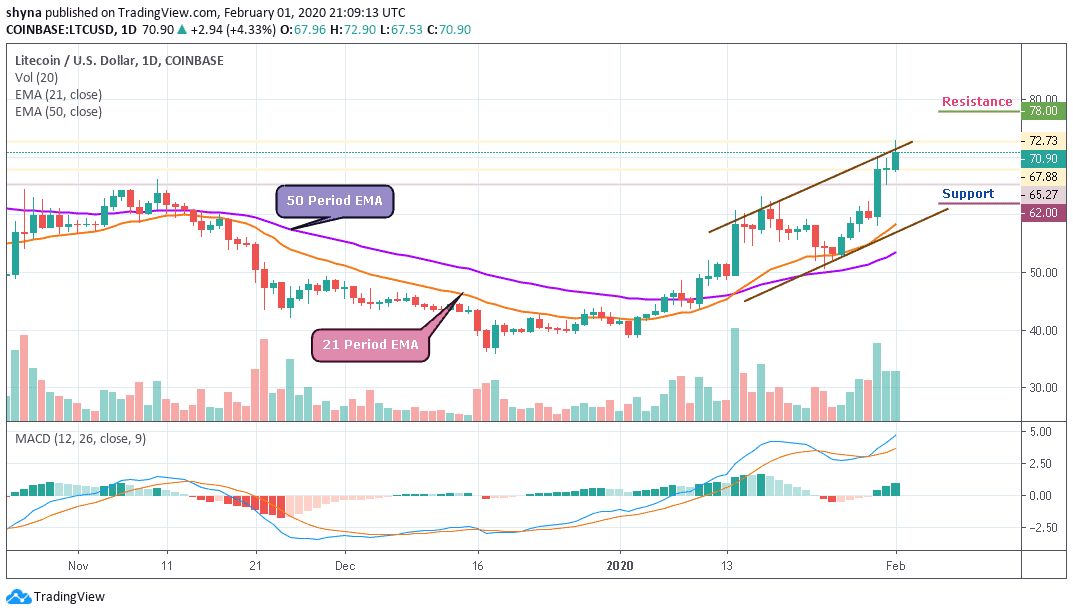
Yesterday, after the coin tested $65.27 on the daily chart, LTC/USD underwent a much-needed break to the positive side. The coin posted gains of over 4.33% in the last 24 hours, with the coin trading above the 21 periods EMA and 50 periods EMA at a price of $70.90 as at the time of writing while the signal lines of MACD are within the positive side.
However, LTC/USD has resumed back after a slight drop from near the $50 since January 24. The price is now roaming around the $70.90 level if the market continues the surge and squeeze; the $75 resistance level is likely to surface in the next few positive moves. Similarly, the Litecoin (LTC) might further look for higher price levels if the bulls continue to show commitment.
Moreover, the market is currently displaying a sign of subduing volatility with price ready to cross above the channel. Meanwhile, taking a look at the daily chart, we can see that the trading volume is rising heavily. If the LTC/USD pair decides to stay under the control of the bulls, the price may roll to the nearest resistance at $78, $80 and $82 levels. But on the downside, any movement around the EMAs may bring the price to the support of $62, $60 and $58 levels.
When compared with Bitcoin, Litecoin (LTC) is making an attempt to cross above the upper boundary of the channel for the price to reach the nearest resistance at 7800 SAT. This resistance may be effectively exceeded and the price could eventually need to close above it, therefore, there might not be any reason to expect the long-term bullish reversal.
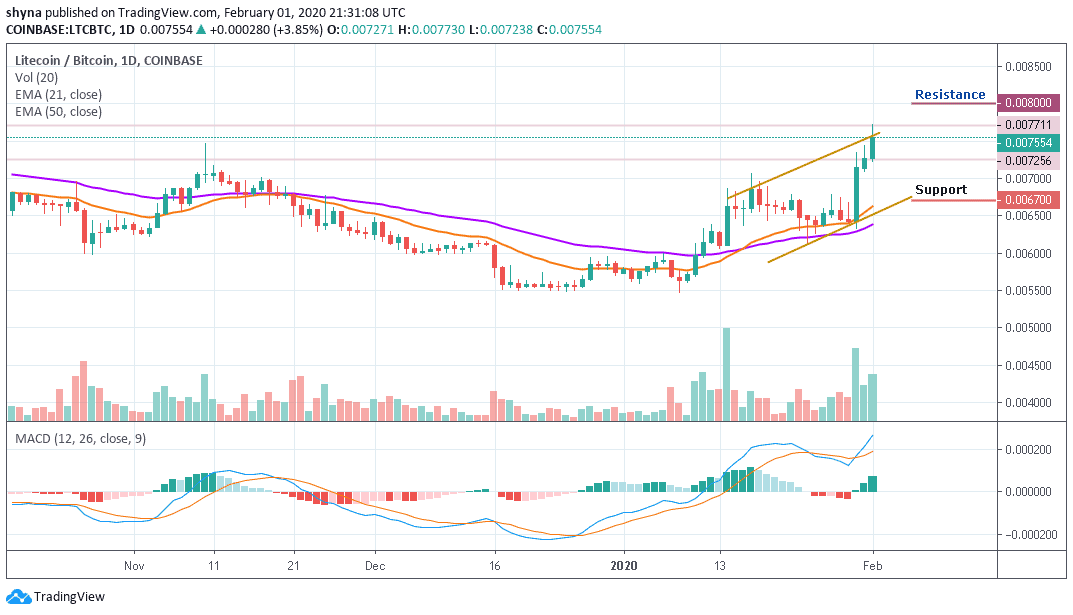
However, if the coin decides to face the south, it could refresh lows under 7000 SAT and a possible bearish continuation may likely meet the major support at 6800 SAT before falling to 6700 SAT and below while the buyers could push the market to the potential resistances at 8000 SAT and above as the MACD signal lines are extremely at the positive side.
Please note: Insidebitcoins.com is not a financial advisor. Do your research before investing your funds in any financial asset or presented product or event. We are not responsible for your investing results.
Join Our Telegram channel to stay up to date on breaking news coverage