Join Our Telegram channel to stay up to date on breaking news coverage
LTC Price Prediction – May 26
The price of Litecoin narrows below the moving averages but the downside is protected at $40.
LTC/USD Market
Key Levels:
Resistance levels: $50, $52, $54
Support levels: $35, $33, $31

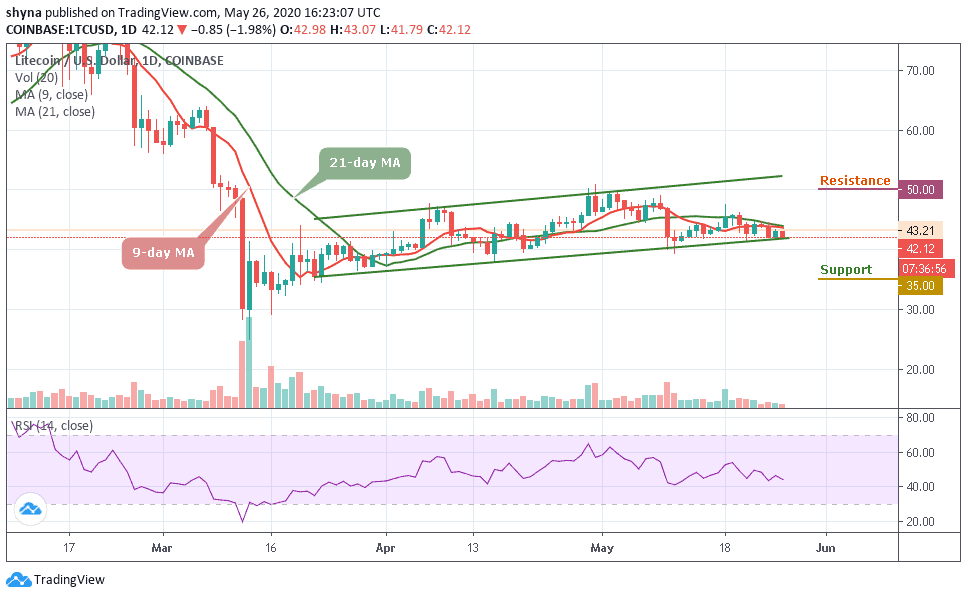
LTC/USD is embarking on sideways trade action in a narrow range between short-term support of $42 and resistance at $44. Since the start of this month, LTC/USD has reduced its value below a key downtrend resistance. The $40 support stood out against bears, especially during the free fall that occurred last week.
Meanwhile, from a technical point of view, the coin is still in the hands of the bulls. This does not mean that buyers are not present, but their efforts seem sufficient to keep the price above the immediate support at $42 and the main support at $40.
However, if the coin fails to rally from the current trading level, it is more likely that traders see the coin falling to a new trading low. A break below the $40 support level may provoke an even deeper decline towards the $35, $33, and $31 support levels.

Moreover, the daily chart highlights that the 9-day and 21-day moving averages which are the key technical region which bulls need to break. The resistance levels to watch for lie at $50, $52, and $54, and a move above this key technical metric should encourage further LTC/USD buying.
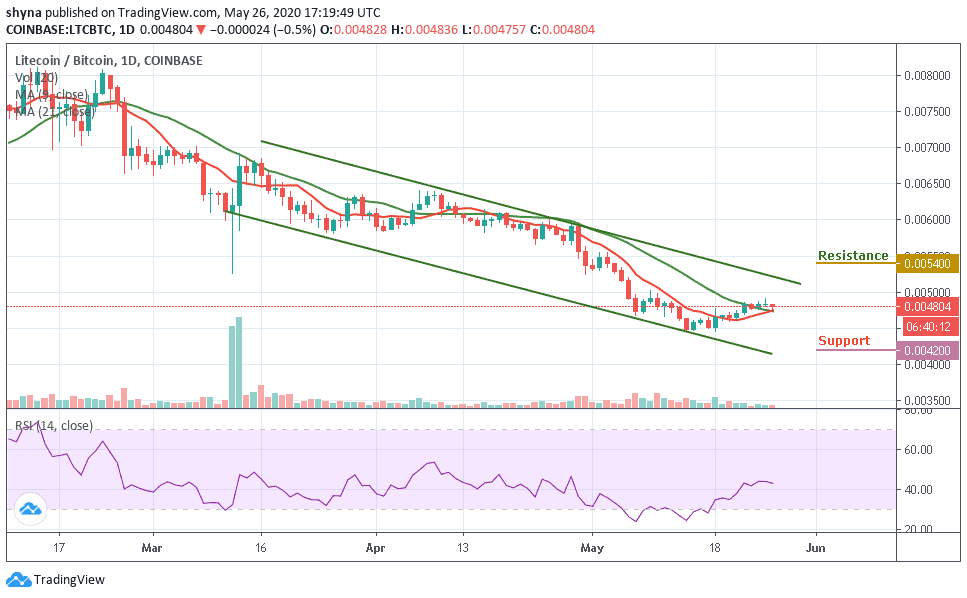
When compared with BTC, the price in Litecoin is moving in sideways above the 9-day and 21-day moving averages. The number seven crypto on the market cap is yet to define its real direction because the market movement has remained clouded by bearish prices for the past few days.
However, as the technical indicator RSI (14) moves in the same direction above the 40-level, the market may likely move sideways with a possible break down and further declines could be at 4200 SAT and below, establishing a new low for the coin. Meanwhile, any bullish movement could push the coin to reach the resistance levels of 5400 SAT and above.
Please note: Insidebitcoins.com is not a financial advisor. Do your research before investing your funds in any financial asset or presented product or event. We are not responsible for your investing results.
Join Our Telegram channel to stay up to date on breaking news coverage

