Join Our Telegram channel to stay up to date on breaking news coverage
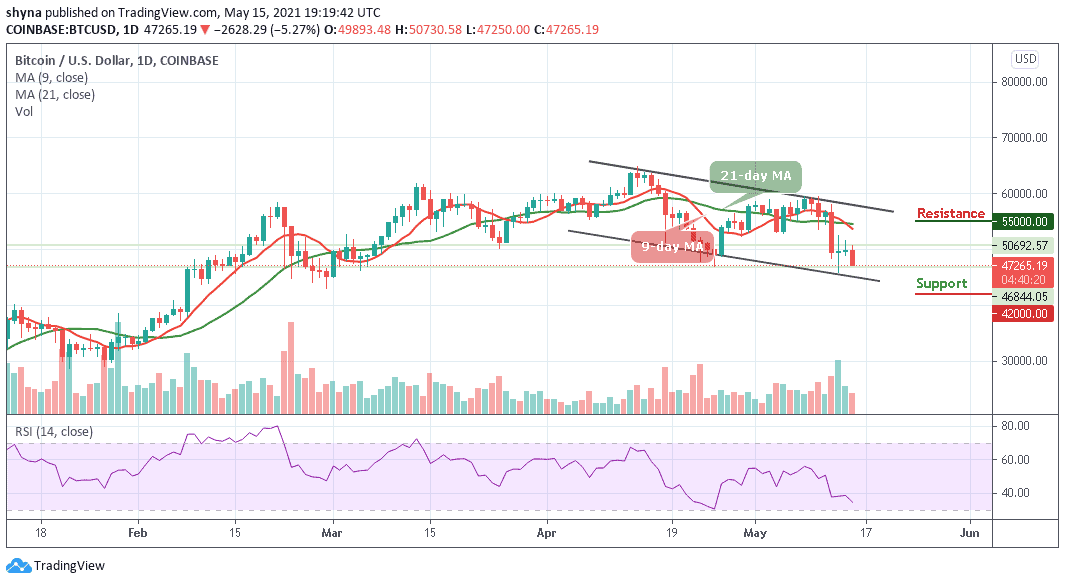
Litecoin Price Prediction – May 15
The Litecoin price has dropped by 2.43% following the current bearish action in the market.
LTC/USD Market
Key Levels:
Resistance levels: $375, $395, $415
Support levels: $255, $235, $215
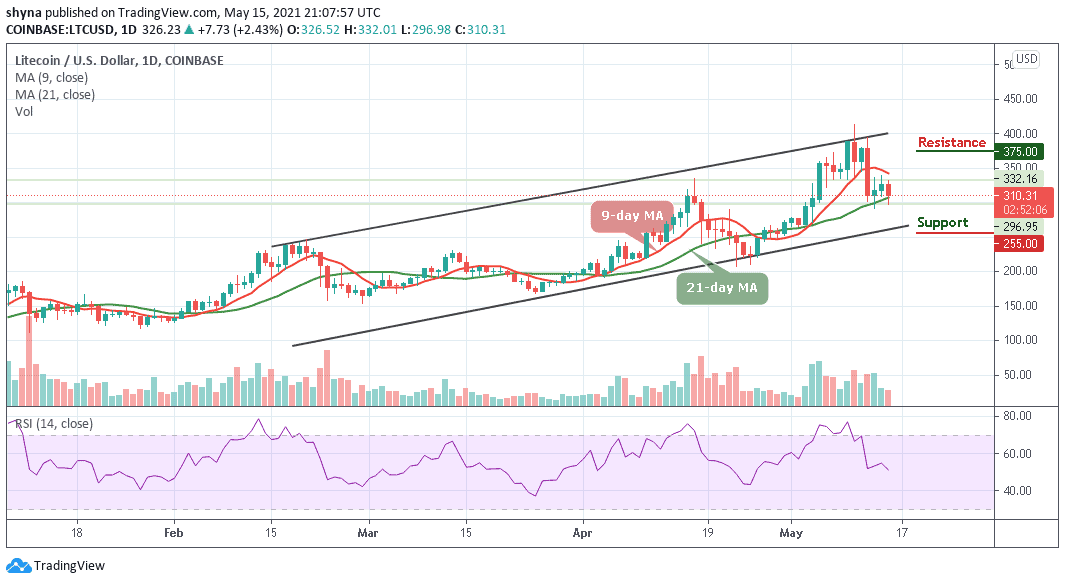
In the past few days, LTC/USD was spotted dealing at $291 low, and then later closed above this level. Meanwhile, the Litecoin price has taken the downhill road and the tremendous loss in the price is indicating a delayed recovery. Meanwhile, LTC/USD has given some great results in the past but it is speculated to retain the same momentum in some time. More so, the current market pressure seems to take a while and once this is lifted, the Litecoin (LTC) could once again shine.
Litecoin Price Prediction: Consolidating to the Downside
The more the Litecoin price fails to recover from the current trading levels, the greater the chances that we will see cryptocurrency falling to another new trading low. However, a break below the lower boundary of the channel may provoke an even deeper decline towards the support levels of $255, $235, and $215.
At the time of writing, LTC/USD is changing hands at $310.31., a break above the 9-day and 21-day moving averages may push the Litecoin price to a high of $375, $395, and $415 resistance levels. Meanwhile, the Relative Strength Index (14) is moving below 55-level indicating the coming of the bearish movement in the market.
When compares with Bitcoin, the daily chart that the market is trading within the ascending channel as the price touches the daily low at 6296 SAT. Meanwhile, if the bulls can halt the current market value and follow the positive direction, the price may break above the upper boundary of the channel and the nearest resistance level lie at 7100 SAT and above.
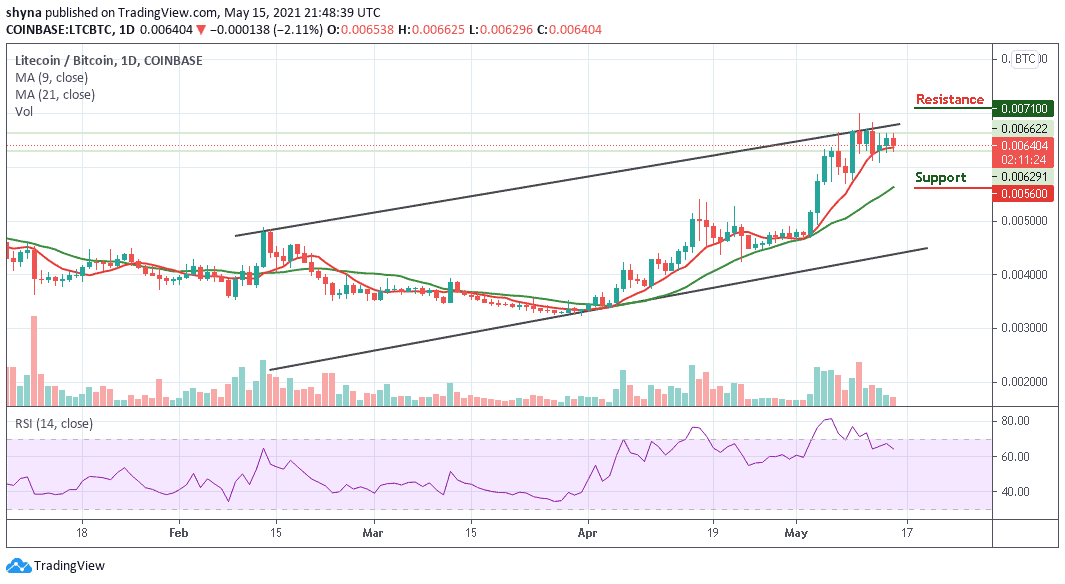
Moreover, for a downward continuation, the 6000 SAT is likely to resurface and if the 6400 SAT fails to hold, the Litecoin price may further drop to the support level of 5600 SAT and below. Meanwhile, the Relative Strength Index (14) is moving below 65-level, which could give additional bearish signals into the market.
Join Our Telegram channel to stay up to date on breaking news coverage