Join Our Telegram channel to stay up to date on breaking news coverage
Litecoin Price Prediction – February 5
The Litecoin price escalates, but a break above $130 may pull the coin towards $150 in the coming trading sessions.
LTC/USD Market
Key Levels:
Resistance levels: $160, $170, $180
Support levels: $75, $65, $55

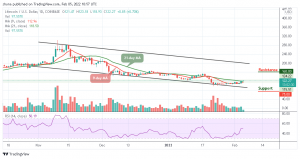
LTC/USD is currently trading around the resistance level of $122.27 after touching the daily high of $123.18 in the early hours of today. However, this could easily pave the way for gains above $130 and towards $150. Therefore, if the technical indicator Relative Strength Index (14) moves around 50-level, the market may show that the bullish grip may be getting stronger.
Litecoin Price Prediction: Litecoin (LTC) May be Ready to go Higher
The Litecoin price is currently holding the ground above the 9-day and 21-day moving averages after a major recovery from $118.93. This shows that buyers may begin to have the upper hand in the price movement, and they could easily push the coin towards the potential resistance of $160, $170, and $180. In other words, if the buying action fails to break above $125, then LTC/USD could instead settle for consolidation.
However, it is about time that buyers increase their confidence in the recovery because $150 is still achievable. Therefore, if the bears push the coin below the moving averages, the support levels of $75, $65, and $55 may be reached.
Against Bitcoin, the Litecoin price remains above 40-level as the 9-day MA is likely to cross below the 21-day MA. Meanwhile, if the market price eventually remains and closes above 9-day and 21-day moving averages, traders might expect a long-term bullish movement.
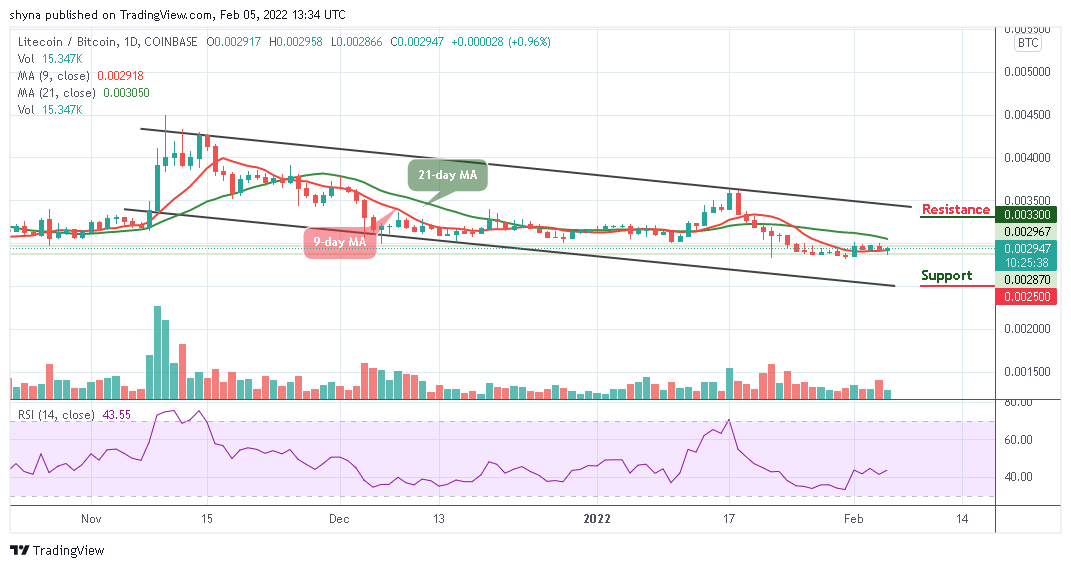
Meanwhile, any bearish movement towards the lower boundary of the channel may likely meet the major support at 2600 SAT before falling to 2500 SAT and below while the buyers may need to push the market to the potential resistance at 3300 SAT and above as the technical indicator Relative Strength Index (14) keeps moving above 40-level to give more bullish signals.
Looking to buy or trade Litecoin (LTC) now? Invest at eToro!
68% of retail investor accounts lose money when trading CFDs with this provider
Join Our Telegram channel to stay up to date on breaking news coverage