Join Our Telegram channel to stay up to date on breaking news coverage
Litecoin Price Prediction – June 13
The Litecoin price is approaching the $150 support as bearish signals are still widespread.
LTC/USD Market
Key Levels:
Resistance levels: $245, $265, $285
Support levels: $85, $65, $45
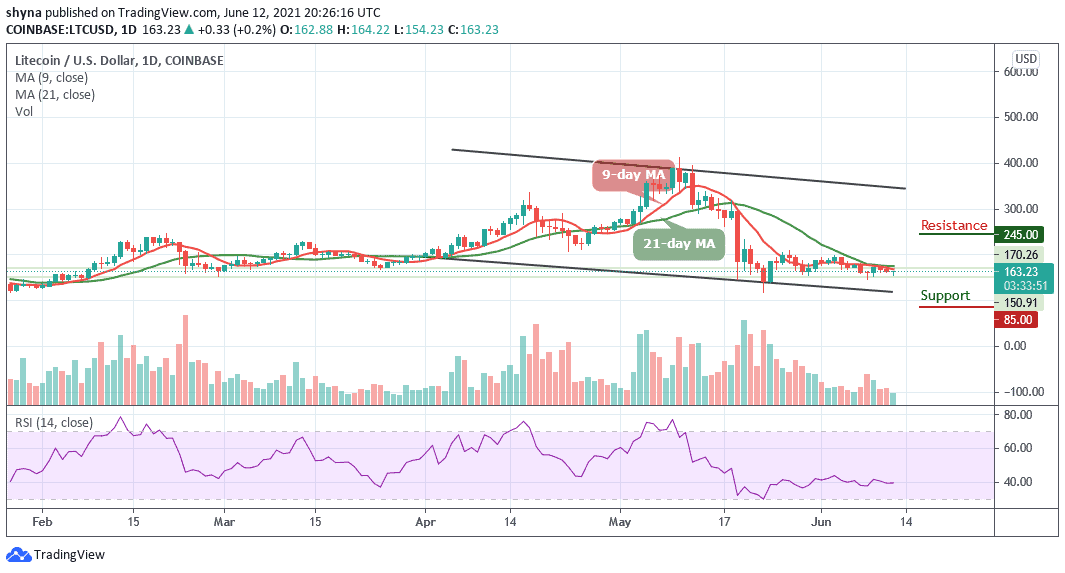
LTC/USD has been looking bearish as the price tested and printed below $160 to touch the low of $158.06 support level. The price is also trading under both 9-day and 21-day moving averages within the channel. Looking at the daily indicator, the Relative Strength Index (14) is seen trading below 40-level. The trading volume has also picked up immediately after the selling kicked in. Therefore, $150 will now be the main level of support that needs to be watched.
Litecoin Price Prediction: Where is LTC Going Next?
The Litecoin price begins today’s trading without any rise after which the bears grabbed the price and dragging it below the point where it touches the daily low of $158.06 support level. With this decline, the coin may not be able to maintain its effectiveness before showing signs of a downtrend.
However, the intraday movement of the coin is quite unstable, but starting at $150, a rebound may likely occur, and if the bulls could strengthen the market and push the Litecoin price to cross above the 9-day and 21-day moving averages, LTC/USD may likely reach the potential resistances at $245, $265, and $285 but on the contrary, the continuation of the bearish movement could push the market below the lower boundary of the channel which could meet the supports at $85, $65, and $45 respectively.
Against Bitcoin, the Litecoin price has been trading at the downside for the past few months. Recently, the coin keeps moving below the 9-day and 21-day moving averages. and crossing below the lower boundary of the channel may likely hit the support level at 3800 SAT and below.
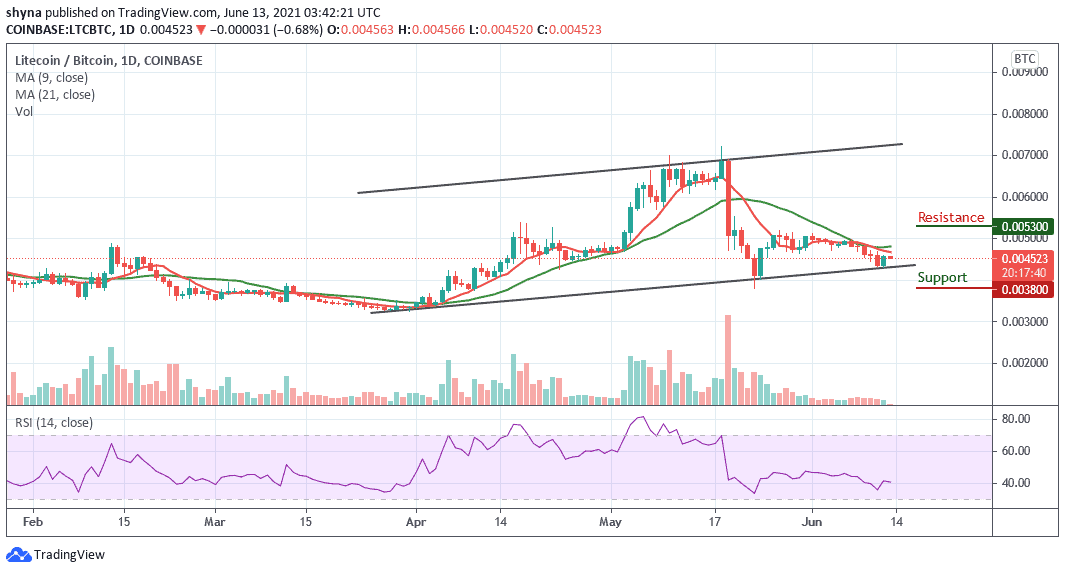
However, any attempt by the bulls to push the Litecoin price above the 9-day and 21-day MAs may likely find the potential resistance level of 5300 SAT and above. Meanwhile, looking at the daily chart, the price of Litecoin is currently changing hands at 4523 SAT and the coin may continue to range-bound as the technical indicator Relative Strength index (14) moves in the same direction, suggesting a sideways movement.
Looking to buy or trade Litecoin (LTC) now? Invest at eToro!
75% of retail investor accounts lose money when trading CFDs with this provider
Join Our Telegram channel to stay up to date on breaking news coverage