

Join Our Telegram channel to stay up to date on breaking news coverage
LTC Price Prediction – March 23
Litecoin (LTC) gains 8.46% in the last 24 hours to touch $47.03. It may find the next resistance at $45.
LTC/USD Market
Key Levels:
Resistance levels: $50, $55, $60
Support levels: $25, $20, $15
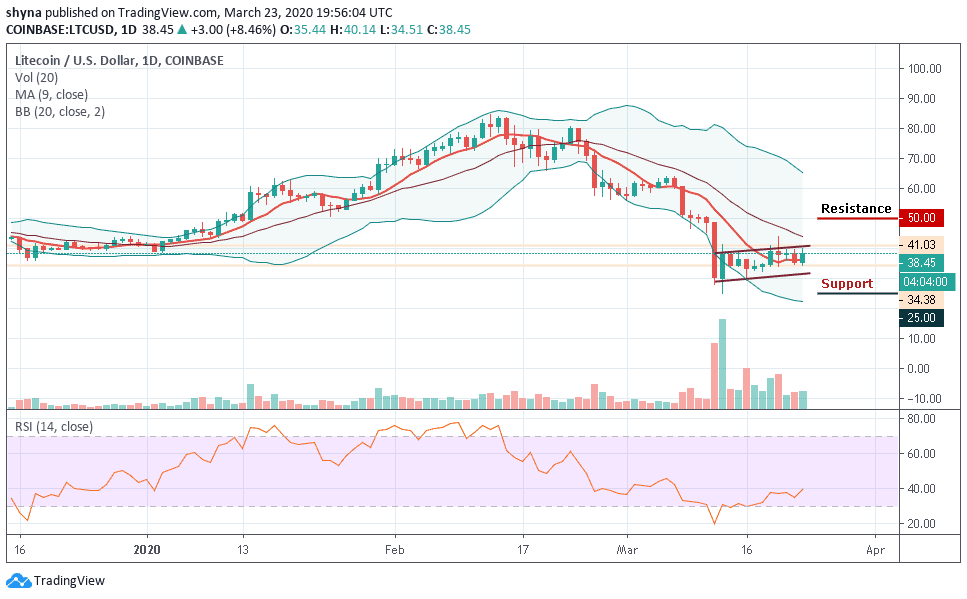
LTC/USD has exhibited strength over the last 24 hours but managed to regain some ground amid technical correction from where it has traveled from $34 to $41. The coin has recovered from the sharp sell-off during early Asian hours. More so, the range of the price swings has been between $29.72 and $44.02. The overall gain of the day stands at 8.46%.
However, though the current price of LTC/USD at $47.10 is around the 9-day moving average within the channel and the recovery seems to have started. Therefore, the cryptocurrency needs to continue its up-trending growth in the coming days to recover properly. According to the current trend, the next resistance level may likely be at $48.
Looking at the daily chart perspective, strong resistance is now created above the channel at $44. It could move towards the middle limit of the Bollinger bands and once it moves above it, the recovery may be extended towards $48; the next resistance comes at psychological $50, $55 and $60 levels. On the downside, a sustainable move below the intraday level of $30 will open up the way to a $25, $20 and $15 support levels but the RSI (14) is moving to cross the 40-level.
Against Bitcoin, the Litecoin (LTC) is still following the downward movement, as the coin recently exploded under the solid support of 6200 SAT and continued to fall towards the lower limit of the Bollinger bands. The critical support level is located below the 9-day moving average at level 5500 SAT and below.
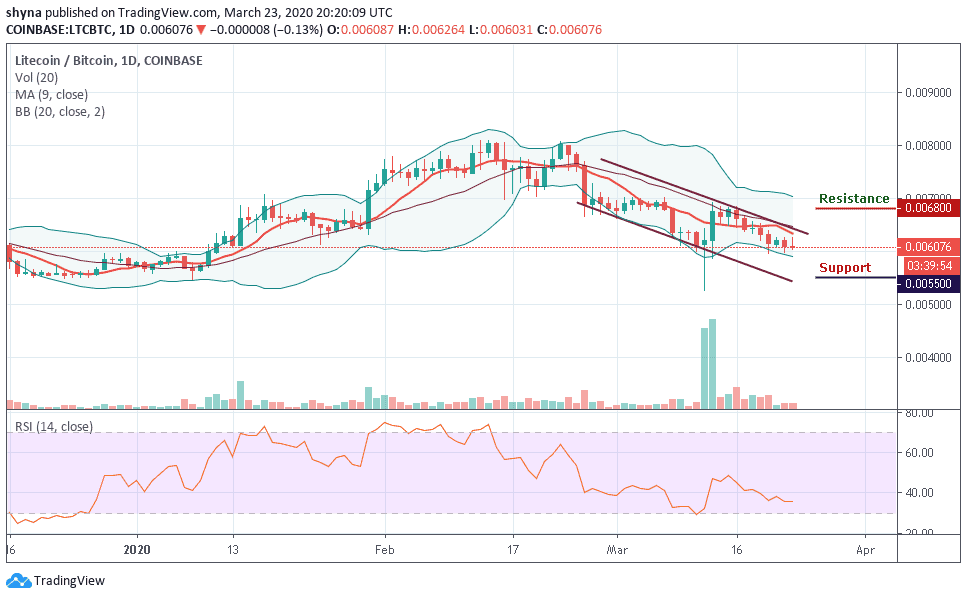
However, any attempt by the bulls to re-power the market, the coin could cross the moving average and the upper boundary of the channel to reach the resistance level at 6800 SAT and above. Meanwhile, the price of Litecoin is currently changing hands to 6676 SAT as the RSI (14) moves around 36-level.
Please note: Insidebitcoins.com is not a financial advisor. Do your research before investing your funds in any financial asset or presented product or event. We are not responsible for your investing results.
Join Our Telegram channel to stay up to date on breaking news coverage
