
Join Our Telegram channel to stay up to date on breaking news coverage
LTC Price Prediction – October 19
Despite the downward trend, Litecoin maintains a higher low pattern over a short-term descending channel.
LTC/USD Market
Key Levels:
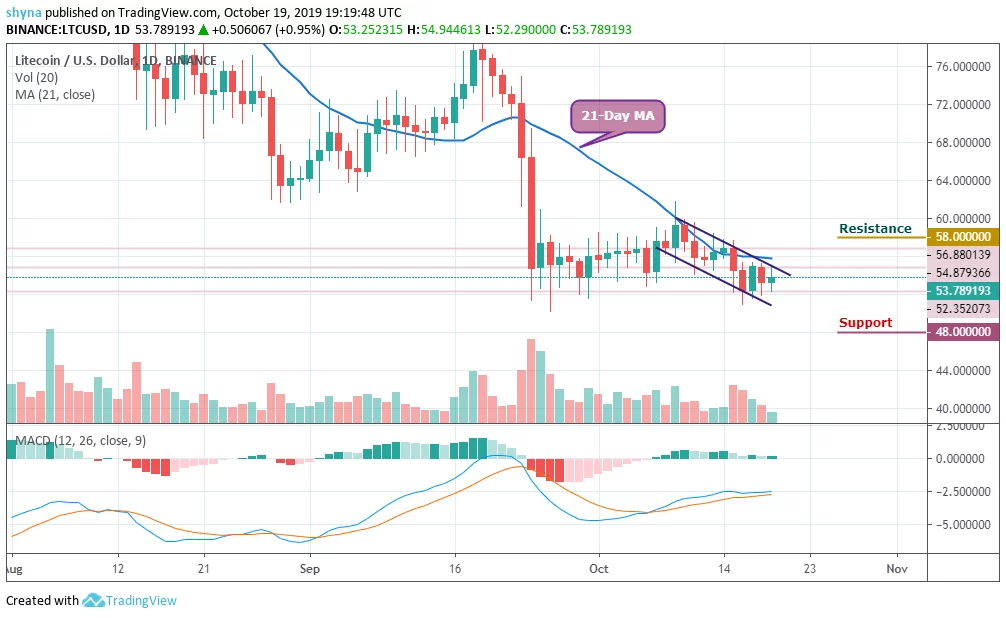
Resistance levels: $58, $60, $62
Support levels: $48, $46, $44
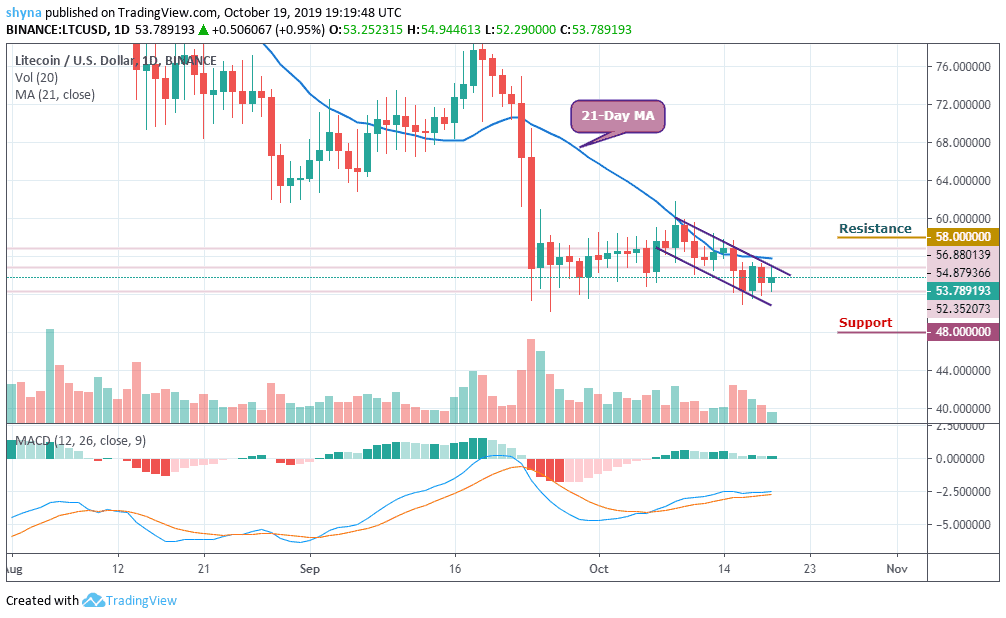
Litecoin (LTC) recorded losses in the last two days. The improvement the coin faced yesterday was short-lived and the price is back to around $53. Yesterday, the price peaked at $55 and a low at $52, but currently, it seems to be heading towards the immediate resistance level.
Looking at the daily chart, we can see that LTC is still sitting at $53. If the price level can be maintained, we could consider a buyback with $54 resistance before breaking the channel and be above the 21-day moving average to reach the resistance levels of $58, $60 and $62. But as it stands now, the bears are attempting to visit close supports before climbing higher.
In addition, the Litecoin is still trading well in a descending channel formation, which shows that the market is undecided. If the price fluctuates below the channel limit, which corresponds to the support at $52, we can expect the LTC market to resume its downward pressure and the price could slip to the critical supports at $48, $46 and $44 respectively.
The MACD for Litecoin remains in negative areas, confirming the downward market dynamics. A drive above the zero-level can bring the market back into a green zone.
Compared to Bitcoin, the price in Litecoin is slowly changing in the channel and below the 21-day moving average. Despite the rebound, the third best-performing cryptocurrency remains to define a real direction because the shares on prices have remained clouded by bullish prices since the daily opening.
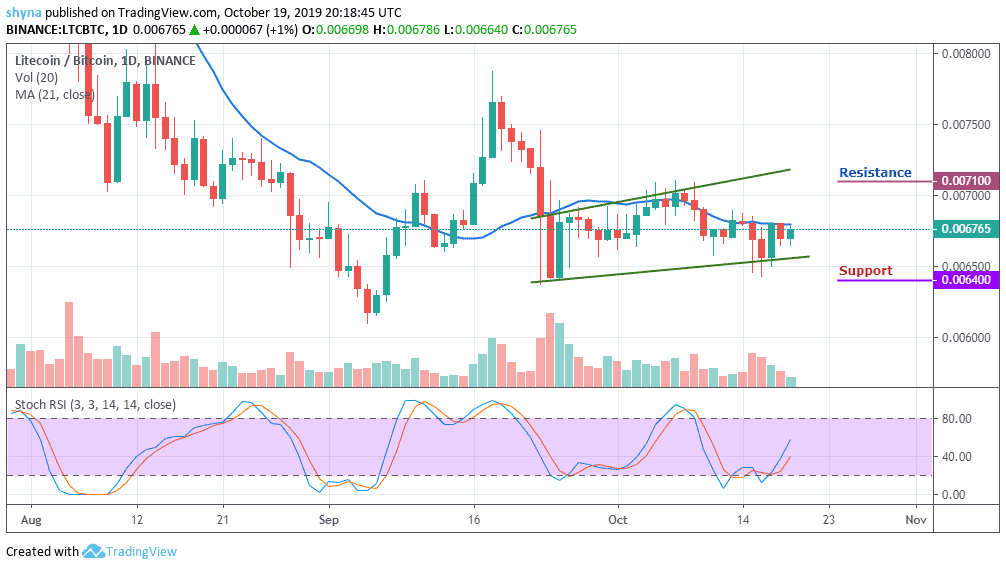
However, as the stochastic RSI moves above level-40, a bullish step back is likely to roll the market back to 0.0071 BTC resistance with a possible break out of the channel and move towards the 0.0073 BTC and 0.0076 BTC resistance levels, establishing a new monthly high for the market.
Please note: Insidebitcoins.com is not a financial advisor. Do your research before investing your funds in any financial asset or presented product or event. We are not responsible for your investing results.
Join Our Telegram channel to stay up to date on breaking news coverage