Join Our Telegram channel to stay up to date on breaking news coverage
LTC Price Prediction – May 15
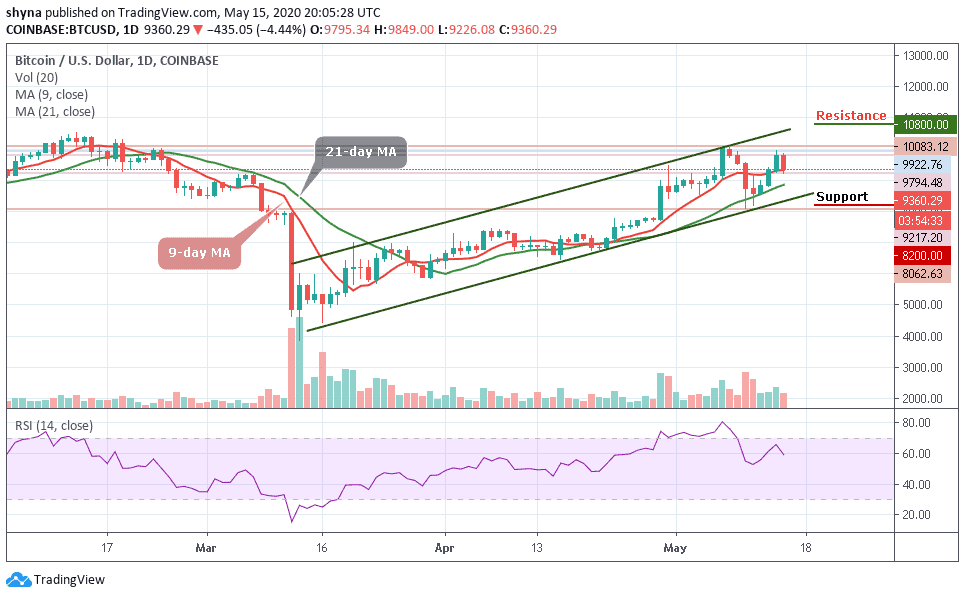
The Litecoin (LTC) may need to stage a meaningful short-term rally; else it could see a worrying decline back towards the $39 support level.
LTC/USD Market
Key Levels:
Resistance levels: $50, $52, $54
Support levels: $35, $33, $31
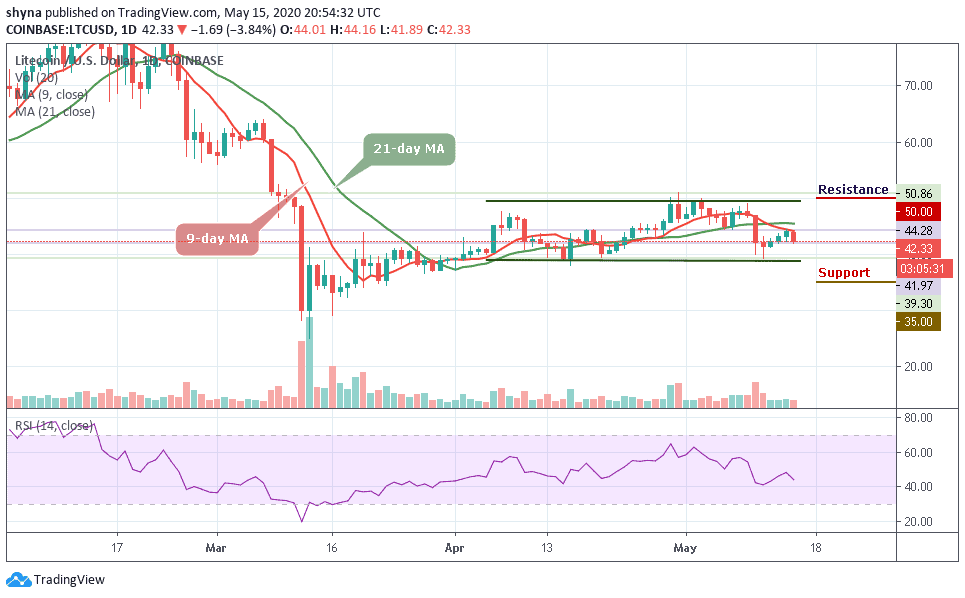
LTC/USD is currently trapped in an incredibly narrow trading range after a bullish rally failed to materialize a few days ago. More so, the coin is trading in its tightest trading band since late last month. In addition, an early day rally towards the $44 level failed to generate sustainable gains within the market, with the coin slipping back under the 9-day and 21-day moving averages.
However, the longer that the LTC/USD pair fails to rally from current trading levels, the greater the chance that we may see the coin falling to a new trading low. A break below the $40 support level may provoke an even deeper decline towards the $35, $33, and $31 levels. The RSI (14) also moves 45-level, which indicates that more bearish signals may soon come into play.
Nevertheless, the daily chart highlights that the LTC/USD pair’s 21-day moving average, at the $45 level, is a key technical region which bulls need to break. If the bulls could successfully break this level, the market price may likely reach the potential resistances at $50, $52 and $54, and a move above this key technical metric should encourage further LTC/USD buying.
The Litecoin price has been very low due to a recurring Against BTC; the pair are still dropping below the 9-day and 21-day moving averages and its price may likely see another sharp drop if the coin falls below the channel. Breaking this trend line could further drag the market to the nearest support levels at 4000 SAT and below.
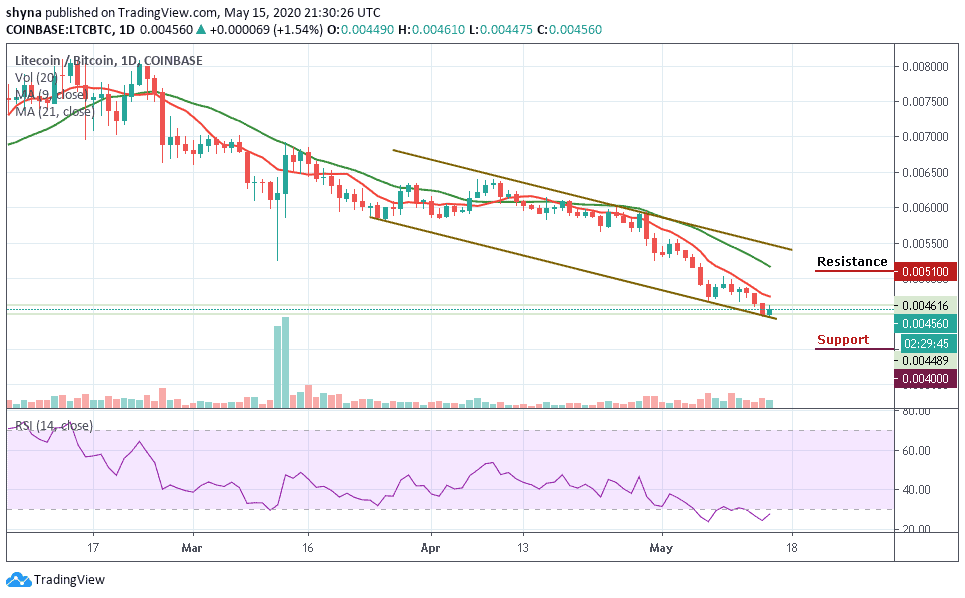
However, LTC is currently changing hands at 4560 SAT and if the bulls can hold the price tight as it is, the next key target price lies at 5100 SAT and 5200 SAT respectively. Meanwhile, the RSI (14) is moving within the oversold zone; possible buying pressure is likely if it begins to climb up.
Please note: Insidebitcoins.com is not a financial advisor. Do your research before investing your funds in any financial asset or presented product or event. We are not responsible for your investing results.
Join Our Telegram channel to stay up to date on breaking news coverage