


Join Our Telegram channel to stay up to date on breaking news coverage
LTC Price Prediction – December 21
LTC/USD will soon need to stage a meaningful short-term rally or the cryptocurrency could see a worrying decline back towards the $36 support level.
LTC/USD Market
Key Levels:
Resistance levels: $45, $47, $49
Support levels: $36, $34, $32
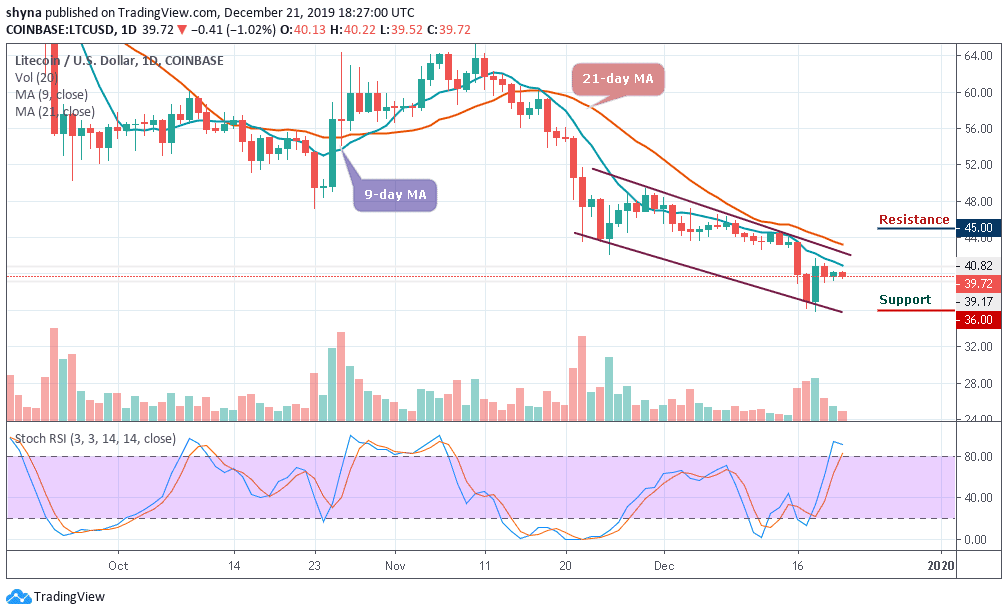
LTC/USD is still trapped in an incredibly narrow trading range after a bullish rally failed to materialize a few days ago. In fact, the cryptocurrency is trading in its tightest three days trading band since late last month year. An early day rally towards the $40 level failed to generate sustainable gains, with the LTC/USD pair slipping back under the 9-day and 21-day moving averages.
However, the longer that the LTC/USD pair fails to rally from current trading levels, the greater the chance that we may see the coin falling to a new trading low. A break below the $37 support level may provoke an even deeper decline towards the $36, $34 and $32 levels. The stochastic RSI for LTC/USD is about entering into the overbought zone, which indicates that more bearish signals may soon come into play.
Moreover, the daily chart highlights that the LTC/USD pair’s 21-day moving average, at the $44 level, is a key technical region which bulls need to break. The resistance levels to watch for lie at $45, $47 and $49, and a move above this key technical metric should encourage further LTC/USD buying.
When compared with BTC, the price in Litecoin is moving in sideways under the 9-day and 21-day moving averages. The number six crypto on the market cap is yet to define its real direction because the market movement has remained clouded by bearish prices for the past few days.
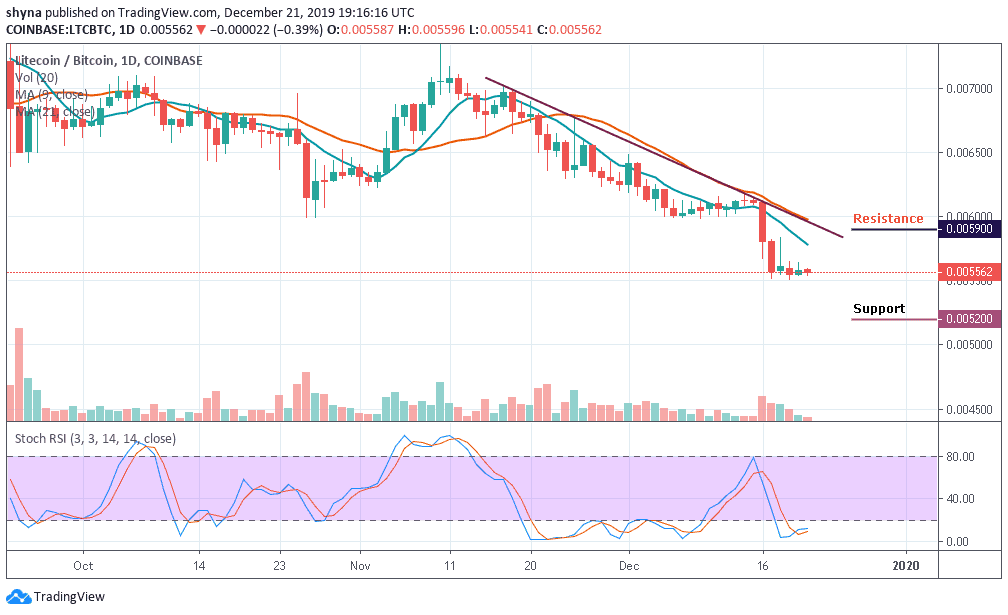
However, as the stochastic RSI moves within the oversold territory, a bearish step back may likely roll the market back to the support of 5400 SAT with a possible break down and further declines could be at 5200 SAT and below, establishing a new monthly low for the market. The resistance levels to watch are 5900 SAT and above.
Please note: Insidebitcoins.com is not a financial advisor. Do your research before investing your funds in any financial asset or presented product or event. We are not responsible for your investing results.
Join Our Telegram channel to stay up to date on breaking news coverage
