Join Our Telegram channel to stay up to date on breaking news coverage
LTC Price Prediction – December 26
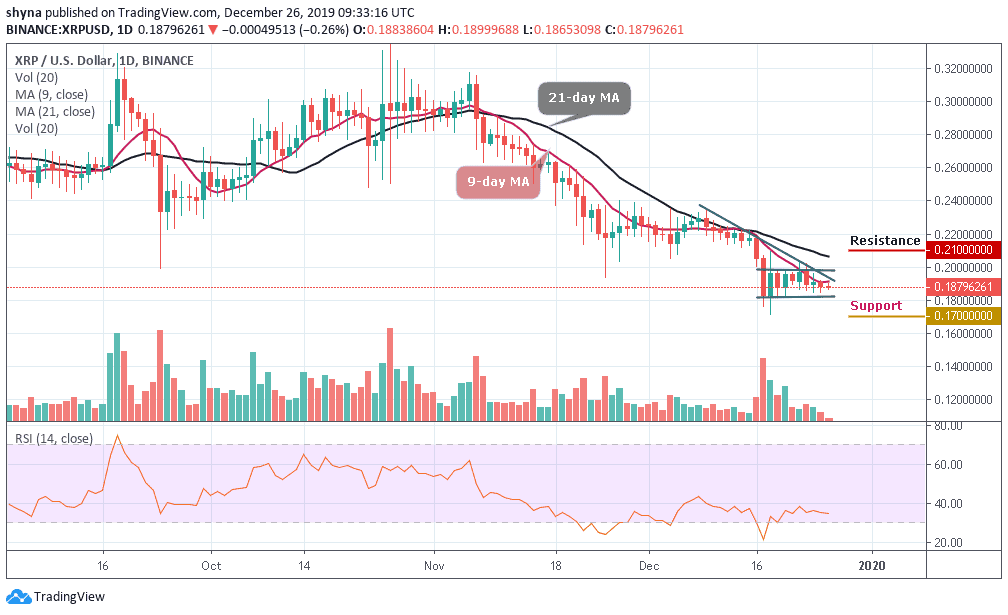
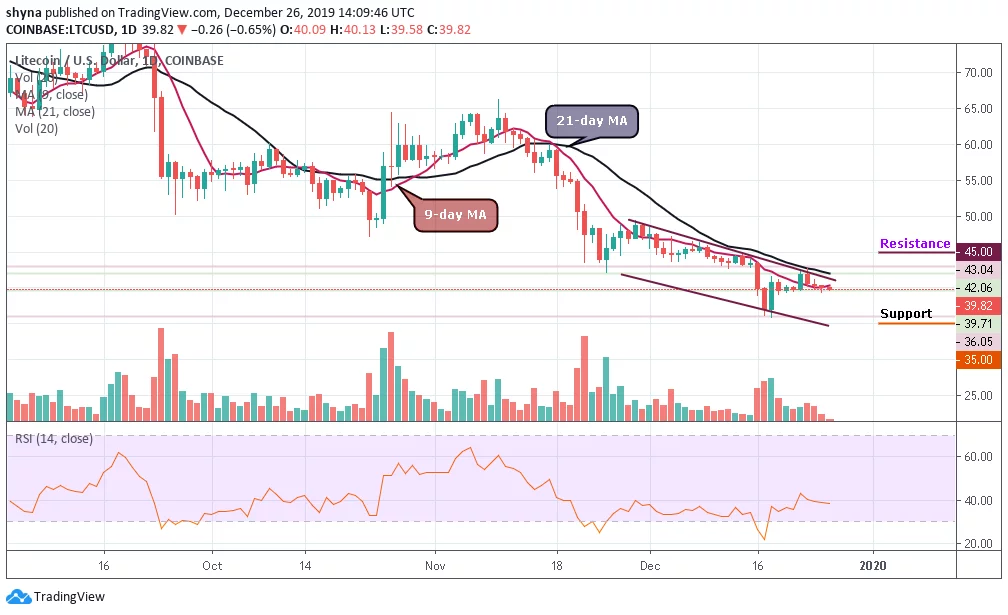
The LTC/USD pair is looking for support at $39, where the market is likely to provide a rebound level for the price.
LTC/USD Market
Key Levels:
Resistance levels: $45, $47, $49
Support levels: $35, $33, $31
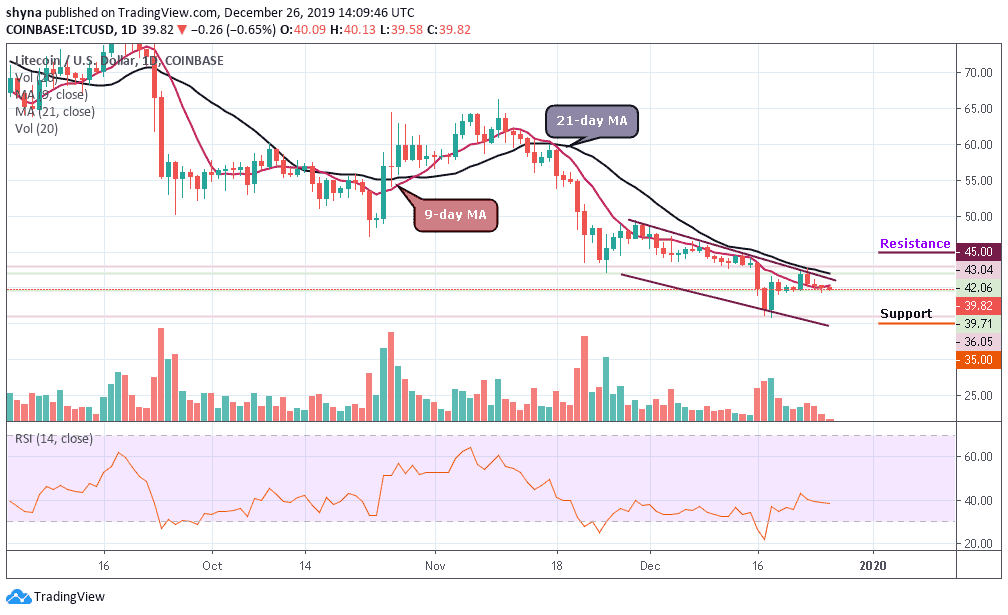
The rebound of December 22 made LTC/USD to record a weekly high at $42 after relying upon strong support at $40. Since November 18, the price of LTC has been trading below $63 due to the recent bearish surge. For this reason, the market has currently dropped by -0.65%, which may become more severe if we see immense selling pressure.
Looking at the daily chart, we can see that LTC is still sitting at $39. If the price level can hold well, we may see a buyback at $40 resistance before breaking up the channel to $42 and above. But as it stands now, the bulls should make an attempt to step back into the market and move the price to the potential resistance levels of $45, $47 and $49.
Meanwhile, considering the latest price drop, the market is likely to fall at $38 and $37 support levels, moving below these mentioned levels, then we can expect the LTC/USD market to continue its bearish pressure while the critical support is expected at $35, $33 and $31 levels. The trading volume remains low and the RSI (14) is currently moving below the 40-level, indicating an indecisive movement in the market.
Pairing it with Bitcoin, Litecoin (LTC) is moving on sideways within the descending channel since December 18 and the price is currently trading at 5513 SAT below the 9-day MA. With volume accumulating on the price chart, the price may likely fall to 5300 SAT before reaching the 5200 SAT and 5100 SAT support levels.
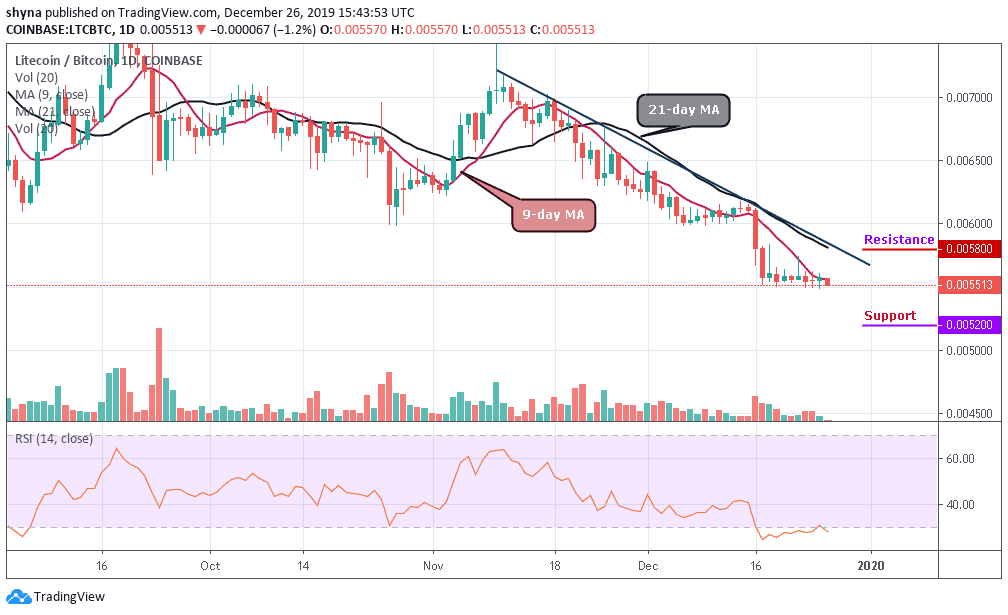
However, the RSI (14) indicator seems moving back into the oversold territory, which indicates a downward trend. Moreover, for LTC/BTC to increase and move towards the resistance levels of 5800 SAT and 5900 SAT, the RSI indicator will need to go above the level-50 to show that the re-occurrence of the bulls back into the market.
Please note: Insidebitcoins.com is not a financial advisor. Do your research before investing your funds in any financial asset or presented product or event. We are not responsible for your investing results.
Join Our Telegram channel to stay up to date on breaking news coverage