Join Our Telegram channel to stay up to date on breaking news coverage
LTC Price Prediction – September 16
The Litecoin (LTC) needs to climb above the 9-day and 21-day moving averages to have a chance to recover.
LTC/USD Market
Key Levels:
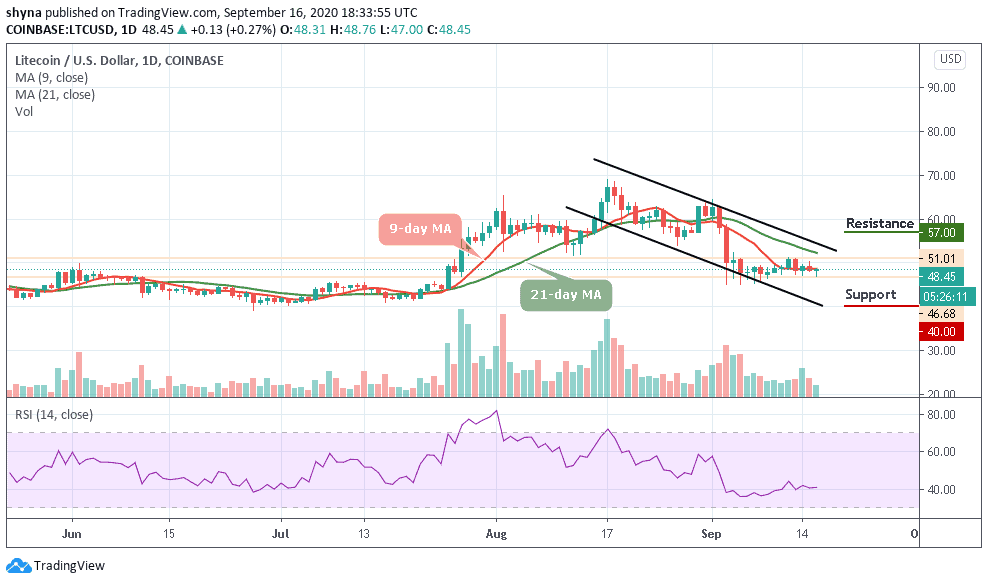
Resistance levels: $57, $59, $61
Support levels: $40, $38, $36
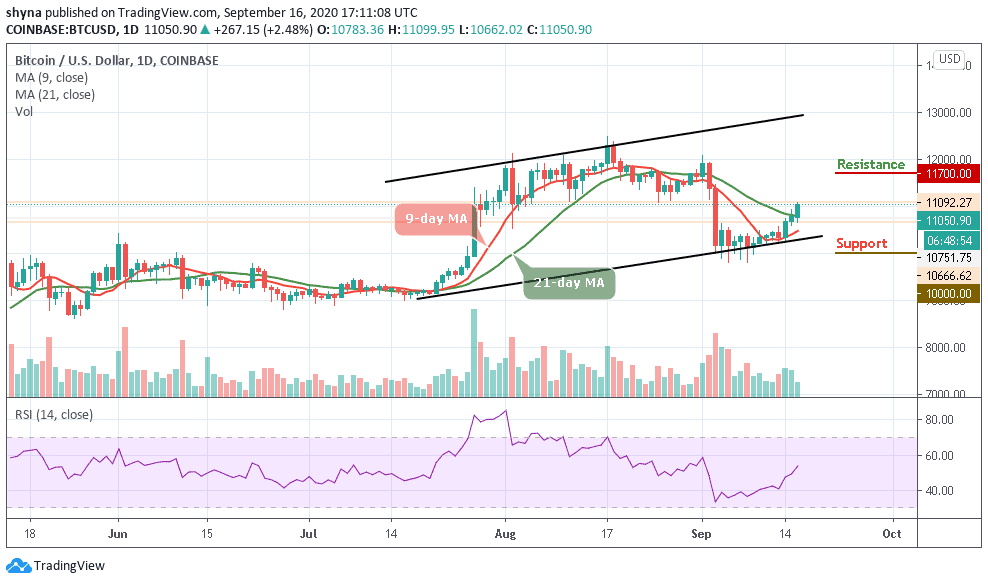
For the past few days, LTC/USD has been taking several bad hits as the coin retains the sideways movement to continue working on its recovery. At the time of writing, the Litecoin (LTC) price is hovering at $48.45, with 0.27% in the green. More so, LTC/USD is been trapped in an incredibly narrow trading range as the bullish rally has failed to materialize several times.
Where is LTC Price Going Next?
The Litecoin (LTC) is yet to clear the hurdles towards the resistance level of $50. Instead, the bears are trying to force their way back to the $45 support level. A break below the $45 support level may provoke an even deeper decline towards the $40, $38, and $36 support levels. Looking at the RSI (14), Litecoin may continue to range as the signal line moves in the same direction around the 40-level.
Nonetheless, if the bulls gather enough strength, they may push the market above the 9-day moving average within the descending channel. Any further bullish movements may find the resistance levels of $57, $59, and $61. Therefore, this kind of movement above the key resistance levels may encourage more buying.
Against BTC, Litecoin is significantly bearish on the daily price chart. Now that the price is falling, the sellers are posing more threat to the 4300 SAT support level where the nearest target lies. More so, an eventual break may likely lead to the collapse of Litecoin.
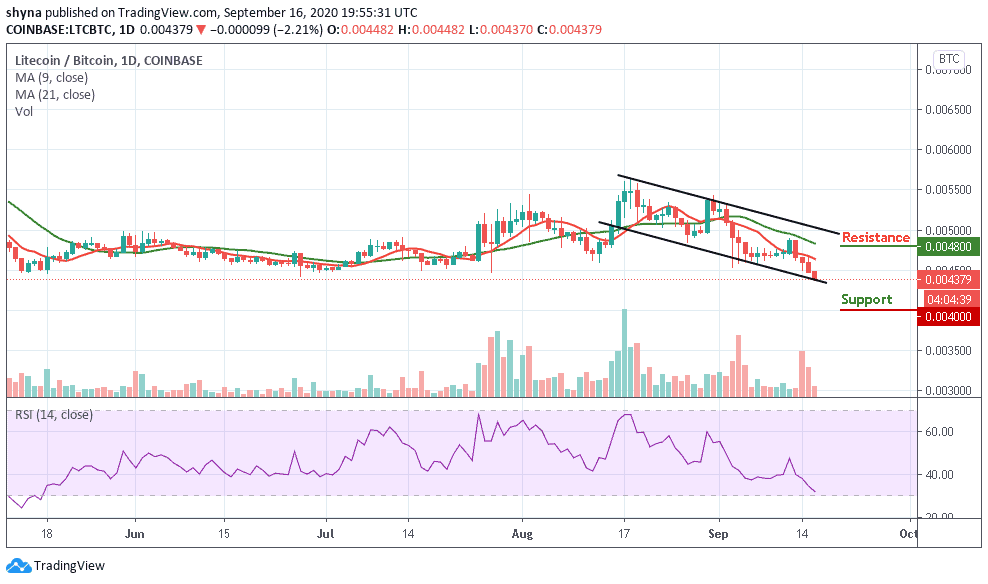
However, a further bearish continuation may likely meet the major support at 4000 SAT before falling to 3800 SAT and 3600 SAT while the buyers may likely push the market to the potential resistance at 4800 SAT, 5000 SAT and 5200 SAT respectively. The RSI (14) is seen moving into the oversold region as the coin may remain at the downside.
Join Our Telegram channel to stay up to date on breaking news coverage