Join Our Telegram channel to stay up to date on breaking news coverage
Bitcoin (BTC) Price Prediction – September 16
BTC/USD is claiming all of the attention in the crypto market right now, with a 2.48% gain over the past 24 hours.
BTC/USD Long-term Trend: Bullish (Daily Chart)
Key levels:
Resistance Levels: $11,700, $11,900, $12,100
Support Levels: $10,000, $9,800, $9,600
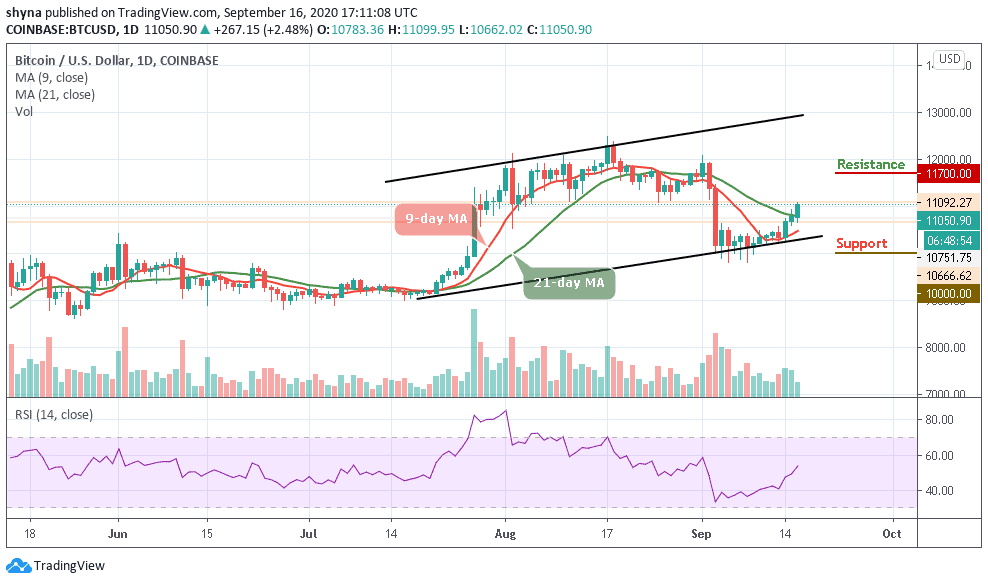
The daily chart shows that BTC/USD is pushing the price above the critical resistance level. The coin is moving above $11,000 to trade at $11,050 at the time of writing. The number-one crypto is moving with strong bullish momentum after a sustainable break above an important 21-day MA. More so, BTC/USD has gained over 2.4% since the beginning of the day as it is using 9-day MA at $10,500 support as a jumping-off ground to develop the upside momentum, which is now gaining traction.
Will BTC Break Through $11,500 Resistance Level?
The return above $11,000 is a long-awaited level which could set the framework for gains towards $12,000. Nevertheless, the technical analysis shows that the bulls are ready for action as the up-trending RSI (14) is moves above 50-level. Any further bullish movement above this level could pave the way for the gains above $11,500. Other resistance levels to watch include $11,700, $11,900, and 12,000.
Looking at the downside, if the price falls back below $10,800 level and move to cross below the moving averages, the bears may wrestle out the control over the situation very quickly. This may likely serve as a major blow for the market sentiments as traders could interpret it as a sign of underlying weakness. The next important support comes at $10,500, which is followed by $10,000, $9,800, and $9,600 support levels.
BTC/USD Medium-Term Trend: Bullish (4H Chart)
Looking at the 4-hour chart, BTC/USD is currently trading around above the 9-day and 21-day moving averages at $11,040. More so, the 4-hour chart also shows that the bullish supply is becoming heavy in the market as the coin remains at the upside.
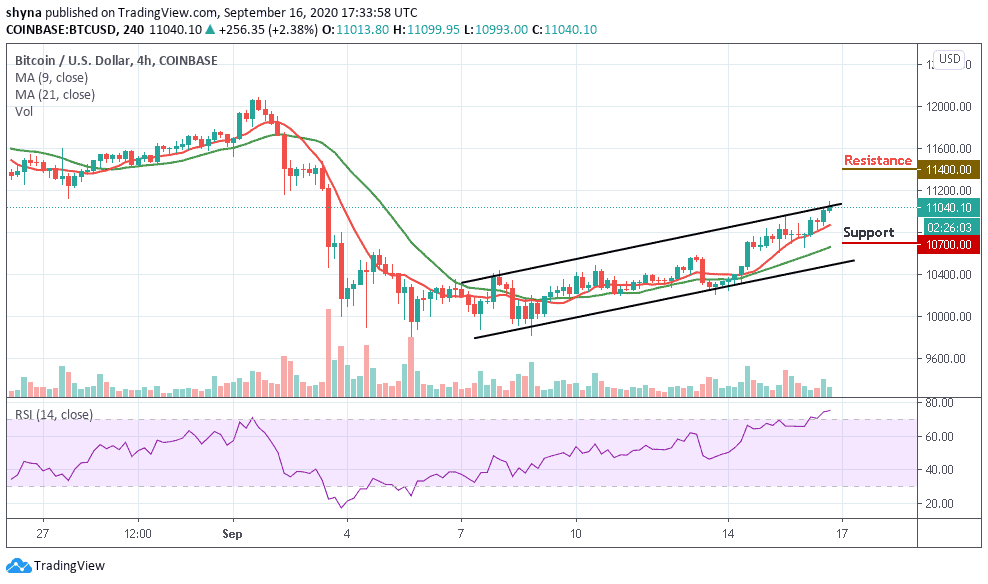
Furthermore, if the buyers could strengthen and energize the market more, they can further push the price to an $11,200 resistance level. Therefore, breaking the mentioned resistance may likely allow the bulls to touch the $11,400 and above as the RSI (14) remains within the overbought region. In other words, if the bulls failed to push the market price upward, the bears could step back to bring the price to the support level of $10,700 and below.
Join Our Telegram channel to stay up to date on breaking news coverage