Join Our Telegram channel to stay up to date on breaking news coverage
Litecoin Market Ranges Averaging $100 – July 18
The LTC/USD market ranges to average $100 to trade around the level of $120 in a slow manner. The valuation of the US Dollar has caused the crypto market to witness a 0.58 percentage rate as of writing.
Market Ranges Averaging $100: LTC Market
Key Levels:
Resistance levels: $150, $200, $250
Support levels: $100, $90, $80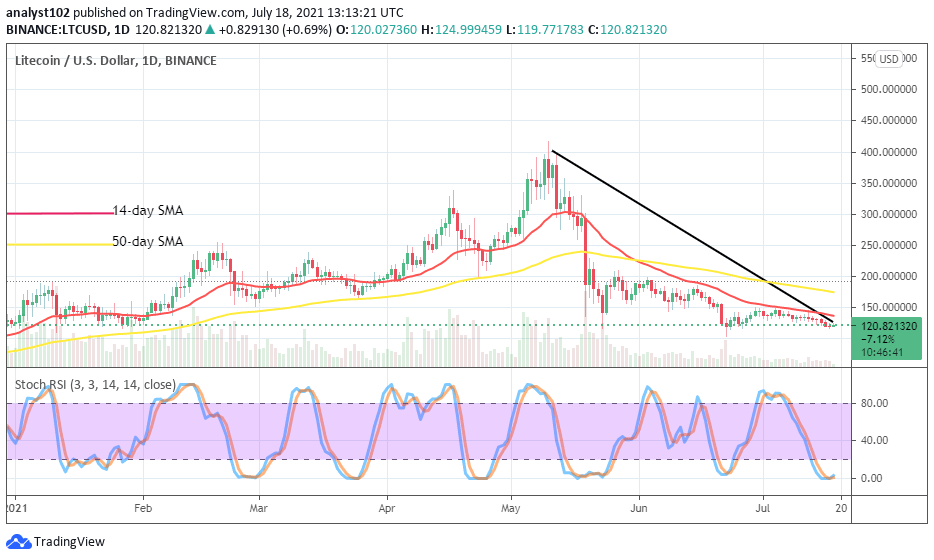
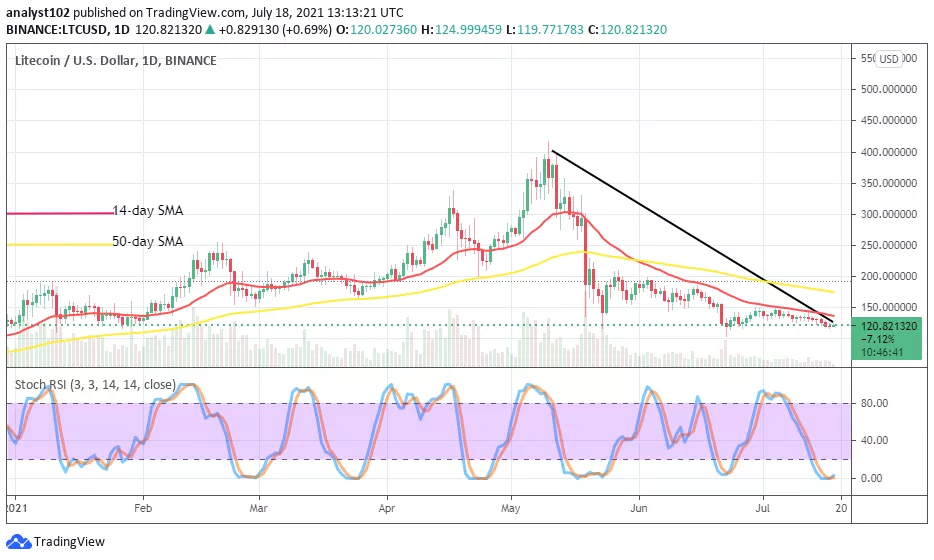
LTC/USD – Daily Chart
The LTC/USD daily chart shows that the crypto market ranges averaging $100 in a very low motion. The market still seems, targeting the support at $100 as price holds stronger below the smaller SMA. The 50-day SMA indicator is over the 14-day SMA indicator. The bearish trend-line remains drawn downward across the SMAs to solidify the presence of a falling force in the market. The Stochastic Oscillators have touch the most critical bottom-line in the oversold region, strongly confirming an oversold trading situation of LTC/USD.
Will the price of LTC/USD hold more in range-bound zones as the market ranges to average $100?
It appears that the LTC/USD’s price will hold more in range-bound zones in the next session as the market ranges to average $100. Featuring a line of variant smaller candlesticks below the smaller SMA shows that the crypto may still stay underneath the upper range value at $150 until a while. In the wake of that assumption, bulls may now act the way of Stochastic Oscillators reading, denoting an extremely oversold trading situation to begin to launch a buy order.
On the downside analysis of the crypto economy, the force to further the movement to the southward appears diminishing on a gradual moving mood. The market value at $100 may for long attempted by a subsequent downward force. A push against the lower point at $100 would most likely allow the crypto market’s bulls to locate support in the process.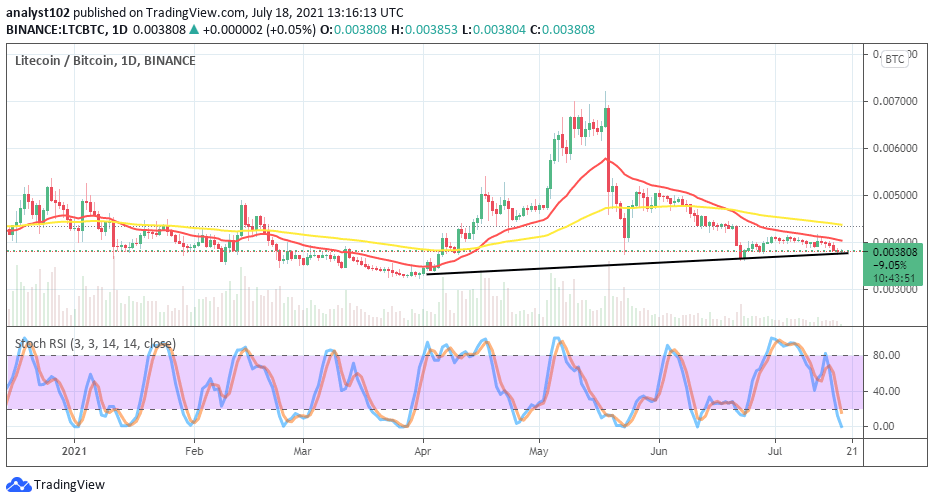
LTC/BTC Price Analysis
On the LTC/BTC price analysis chart, the trending capacity ranges averaging a notable downward point, where the bullish trend-line drew beneath them. The 14-day SMA indicator is below the 50-day SMA indicator. And, they both slightly point toward the south. The Stochastic Oscillators are in the oversold region, yet slightly pointing to the southbound to suggest that the base crypto is weak pairing with the counter crypto. However, two cryptos may as well fully return to a continued ranging price motion.
Looking to buy or trade Litecoin (LTC) now? Invest at eToro!
75% of retail investor accounts lose money when trading CFDs with this provider
Join Our Telegram channel to stay up to date on breaking news coverage