Join Our Telegram channel to stay up to date on breaking news coverage
LTC Price Prediction – July 12
LTC/USD could be staring into another selloff if the pennant pattern support caves in.
LTC/USD Market
Key Levels:
Resistance levels: $48, $50, $52
Support levels: $41, $39, $37

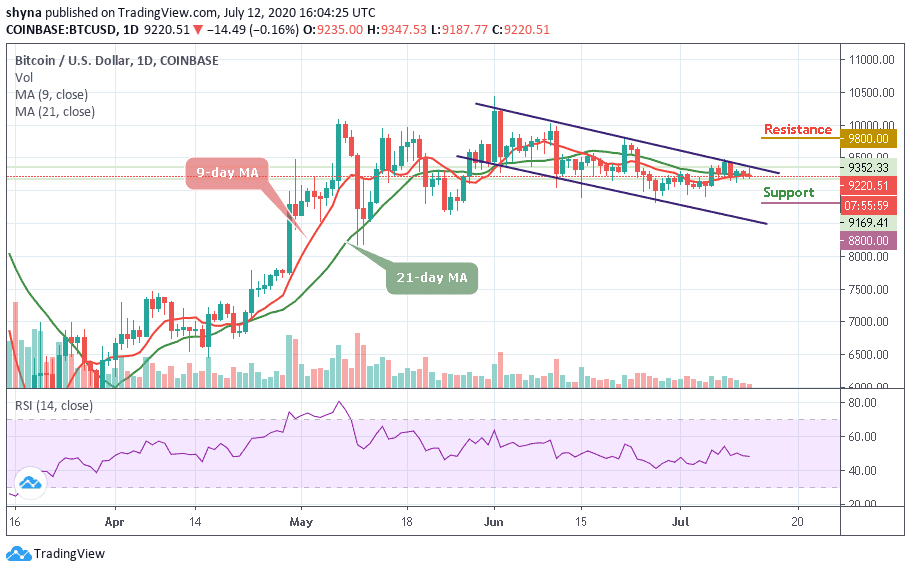
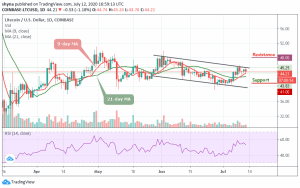
At the time of writing, LTC/USD is changing hands at $44.21, down from the recent high of $45.25 and low of $43.83. The Litecoin, which is the 8th largest digital coin with a current market value of $2.88 billion, is losing about 1.18% in the past 24 hours amid the global correction in the market for crypto-currencies. Bitcoin also pulled out of recent highs when the bulls hit the pause button.
At the moment, the coin is moving synchronously above the 9-day and 21-day moving averages on the market. The price of Litecoin is mainly influenced by speculative sentiment and technical factors, while fundamental developments remain in the shadows. The cryptocurrency market is known for its herd behavior because everything grows and falls simultaneously.
However, LTC/USD tested area above $45, more so, the bulls failed to hold the ground. The wide-spread retracement on the market pushed the coin towards $42 with the next local support created by $50, which is the intraday low. In addition, the critical barrier awaits us on approach to $41 support level. This level is likely to limit the correction and serve as a jumping-off ground for another bullish wave; once it is out of the way, the sell-off is likely to gain traction with the next focus on $39 and $37 support levels.
Meanwhile, on the upside, the initial resistance is created by the upper line of the ascending channel at $46. We will need to see a sustainable move above this level to retest $47. The further bullish movement could touch the $48, $50, and $52 resistance levels considering that the daily RSI (14) moving below the 55-level.
When compared with BTC, the price in Litecoin may start moving sideways above the 9-day and 21-day moving averages. Litecoin price could see another sharp drop at 4700 SAT support level, coming below the moving averages.
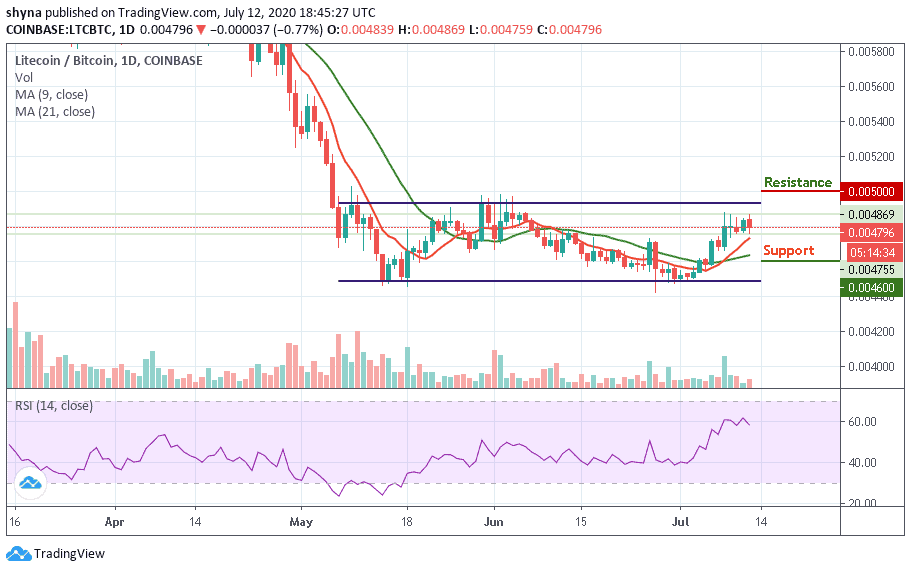
However, as the RSI (14) nosedives below 60-level, a bearish step back may likely roll the market back to the support of 4600 SAT and below, which may establish a new weekly low for the market. Meanwhile, any bullish movement above the channel may hit the resistance levels of 5000 SAT and above.
Join Our Telegram channel to stay up to date on breaking news coverage