Join Our Telegram channel to stay up to date on breaking news coverage
Bitcoin (BTC) Price Prediction – July 12
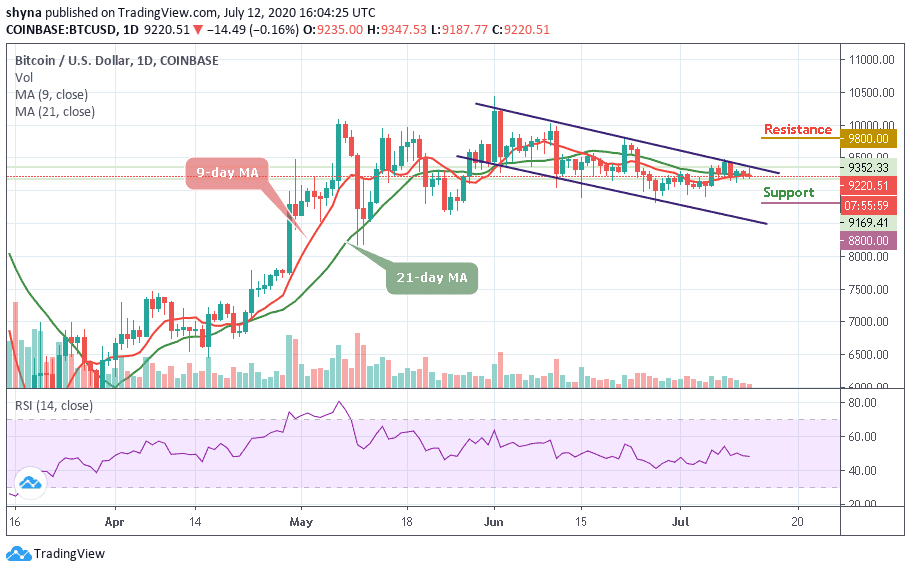
At the moment, BTC/USD is seen dropping over 0.16% within 24 hours as it trades at the $9,220 level.
BTC/USD Long-term Trend: Ranging (Daily Chart)
Key levels:
Resistance Levels: $9,800, $10,000, $10,200
Support Levels: $8,800, $8,600, $8,400

The daily chart reveals that BTC/USD couldn’t break the 9-day and 21-day moving averages with the current consolidation pattern as it fails to close above the $9,300 level. The Bitcoin (BTC) started the day off by trending lower toward the $9,100 level inside the descending channel. Similarly, the first level of support is located at $9,000. Beneath this, support lies at $8,800, $8,600, and $8,400 levels.
However, this marks another day that Bitcoin has failed to break above this channel as it looks to set up another few days of negative price declines beneath $9,000. A break above this channel would have set Bitcoin up to reach the $9,500 level; however, this is looking less and less likely with each failed breakout attempt as the RSI (14) moves below 50-level.
Moreover, we can clearly see Bitcoin fails to break up above the upper boundary of the channel. Today, it couldn’t go higher but seen the coin touching the high of $9,352 level. Although the candle is still yet to close, however, it does look unlikely that the bulls may end up closing above this resistance should in case the technical indicator moves above 50-level. More so, toward the upside, resistance lies at $9,800, $10,000, and $10,200.
BTC/USD Medium-Term Trend: Ranging (4H Chart)
On the 4-hour chart, we expect the coin to gain the lost momentum and hit the trade above $9,500. However, the volatility hovers, and the selling pressure still exists which leads the coin not to be able to cross above the 9-day and 21-day moving averages within the channel. Meanwhile, the $9,050 and below may come into play if BTC breaks below the lower boundary channel.

However, in as much as the buyers reinforce and power the market, traders can expect a retest at $9,300 resistance level, and breaking this level may further allow the bulls to reach $9,450 and above. The RSI (14) is seen trading around 45-level which shows more of sideways movement.
Join Our Telegram channel to stay up to date on breaking news coverage

