Join Our Telegram channel to stay up to date on breaking news coverage
Bitcoin (BTC) Price Prediction – July 12, 2020
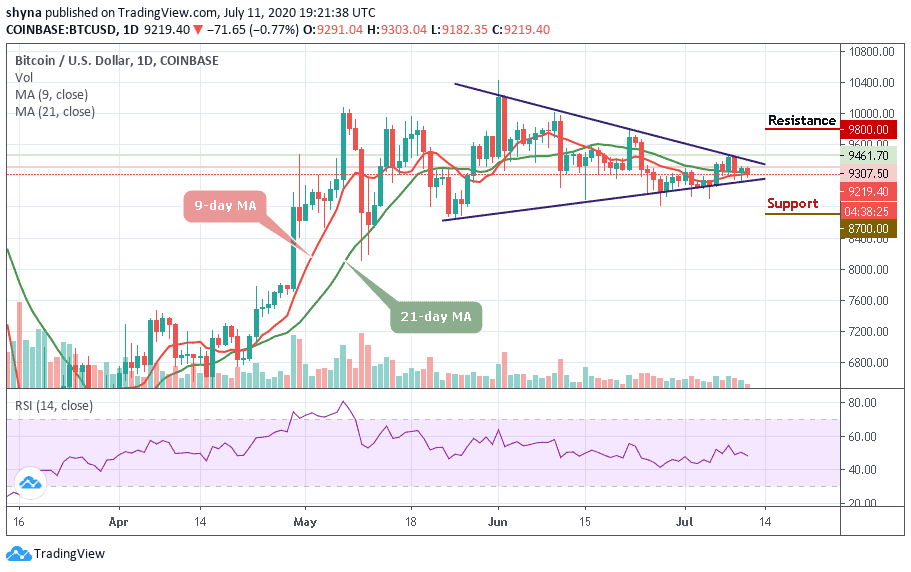
The upward move of BTC/USD has been ongoing since last month because the $9,000 and $9,200 support has been holding consistently. It has positioned Bitcoin bulls to continue to retest of the $10,000 overhead resistance. However, the king coin has shown weakness as it continues to hover above $9,200.
Key Levels:
Resistance Levels: $10,000, $11, 000, $12,000
Support Levels: $7,000, $6,000, $5,000
Despite Bitcoin’s weakness, the key support levels of $9,000 and $9,200 continue to hold. This has contributed to the altcoins surge to higher levels. The massive surge of the altcoins is as a result of Bitcoin’s low volatility in the last two months. At the time of writing, Bitcoin is still hovering above $9,200 for the past 24 hours. The rejection at the $9,500 resistance has caused the king coin to initiate a sharp selloff. Nonetheless, the bulls will attempt to resume an upward move. The bottom line is that if the bulls sustain above $9,500, the upside range trading will resume. As soon as the $9,500 resistance is cleared the next target will be the $9,800. The $10,000 overhead resistance will be retested once the $9,800 is breached.
Note that a repeated retest of the $10,000 and $10,500 area will lead to a possible breakout. The several retests will weaken the overhead resistance. Analysts believe that the benchmark crypto will reach a high of $13,000, once the $10,500 resistance is cleared. Conversely, if the bulls fail to achieve their target, the coin will encounter a bearish reaction. The coin will drop sharply from the overhead resistance. Nevertheless, once the $9,000 to $9,100 support fails to hold, a drop to $8,500 or $8,600 is likely. Meanwhile, BTC had risen to level 50 of the Relative Strength Index period 14. The RSI is at the midpoint which indicates a balance between supply and demand.
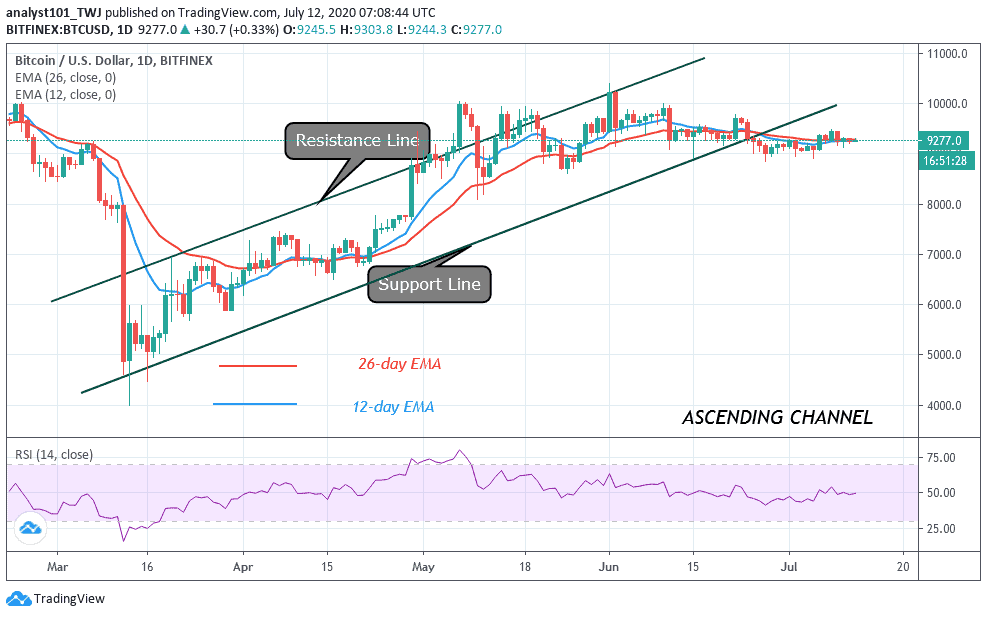
BTC/USD Medium-term Trend: Bullish (4-Hour Chart)
On the 4 hour chart, Bitcoin has been in a range-bound movement between $9,000 and $9,400. The $9,000 and $9,100 has been holding as support while the $9,400 has been acting as resistance.

The price has been stuck between these levels since July 1. The bulls have attempted to break the resistance at $9,400. Buyers pushed BTC to $9,500 high but have been repelled to $9,200 support. On the downside, the bears pushed price to $8,918 low but corrected upward. Nonetheless, at the time of writing the market remains stable above $9,200. Bitcoin is above 40% range of the daily stochastic. It indicates that the market is in a bullish momentum. The bulls are making attempts to break into the $9,300 region.
Join Our Telegram channel to stay up to date on breaking news coverage