Join Our Telegram channel to stay up to date on breaking news coverage
Bitcoin (BTC) Price Prediction – July 11
The price of Bitcoin is stuck in consolidation with support at $9,000 and resistance at $9,400.
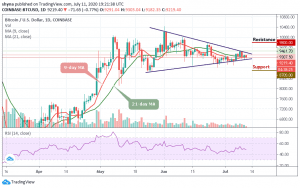
BTC/USD Long-term Trend: Ranging (Daily Chart)
Key levels:
Resistance Levels: $9,800, $10,000, $10,200
Support Levels: $8,700, $8,500, $8,300

Following the rejection at $9,461 seen earlier this week, BTC/USD has entered yet another bout of sideways trading that has done little to offer insight into its near-term outlook. However, the existing trend is ranging which places the market to remain indecisive. Nonetheless, the shrinking volatility may continue to limit the bulls despite the effort to break barriers at $9,300 and $9,400 respectively.
Technically, Bitcoin may hold onto the on-going sideways action a while longer. Currently, there is literally no signal coming from the technical indicator RSI (14) of an impending downward or upward movement. In other words, buying pressure and selling pressure is currently seen canceling out. More so, as the market continues to squeeze, volatility is bound to return to the market. A break above $9,500 would most likely allow gains to hit the potential resistance levels at $9,800, $10,000, and $10,200.
However, any failure by the bulls to move the price up may see a price cut to $9,000 vital support. A further low drive could send the price to $8,700, $8,500, and $8,300 supports. Although the Bitcoin price has yet to decline beneath any crucial support levels as it is currently trading within its previously established trading range between $9,000 and $9,300.
BTC/USD Medium – Term Trend: Bearish (4H Chart)
Looking at the 4-hour chart, Bitcoin’s price is currently trading around $9,208 and below the 9-day and 21-day moving averages after falling from $9,302 where the coin touched today. From a technical point of view, the trend is in the hands of the sellers.
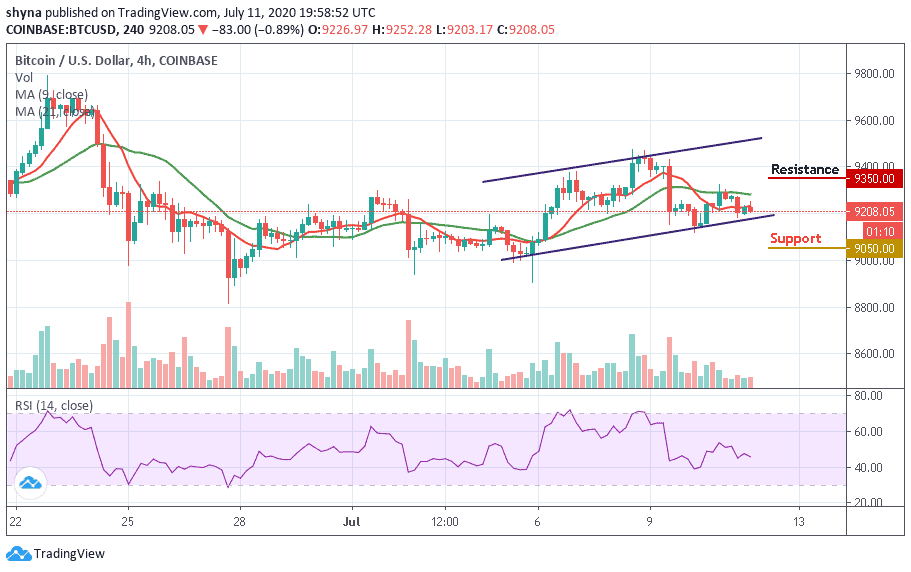
The technical indicator RSI (14) is retreating even though it had not reached the 40-level. As long as the downward trend continues, keeping Bitcoin above $9,500 will be a daunting task. In this case, it is best we look at possible support levels, starting at $9,050 and below. While the resistance lies at $9,350 and above.
Join Our Telegram channel to stay up to date on breaking news coverage