Join Our Telegram channel to stay up to date on breaking news coverage
Litecoin (LTC) Price Prediction – May 18
The Litecoin has finally shown some strength against the US dollar, and it is likely that it will continue to be strong until the end of the week.
LTC/USD Market
Key Levels:
Resistance levels: $52, $54, $56
Support levels: $38, $36, $34
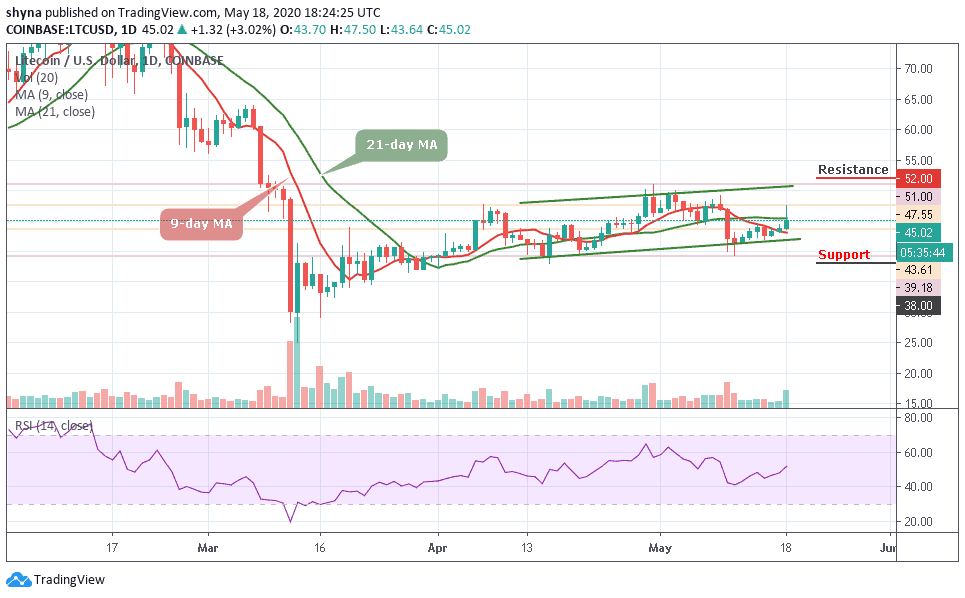
LTC/USD has seen a decent 3.02% price bump over the past 24 hours after touching the high of $47.55, making it one of the best performing cryptos in the top 10. It’s currently trading at around $45.02. The daily chart reveals that the Litecoin (LTC) is showing a strong sign of upside momentum, as it seems to reclaim back the $50 level. The bulls are making a good way to push to escape a bearish technical set up.
For now, the recent 3.02% price hike seen today allowed LTC to break above the 9-day and 21-day moving averages which is a good sign for the bulls. However, if the bulls continue above $47, the next level of significant resistance lies at $50. Above this, we can expect higher resistance at $52, $54 and $56 while the support can be found at $38, $36 and $34. The technical indicator RSI (14) is giving bullish signals which indicate that the bulls are in control of the market momentum now.
LTC/BTC Market
Against Bitcoin, Litecoin has remained fairly static. However, we have seen an increase from 4489 SAT to 4782 SAT today – where resistance was found. The recent increase has also allowed the cryptocurrency to climb above the 9-day moving average which is a promising sign for buyers.
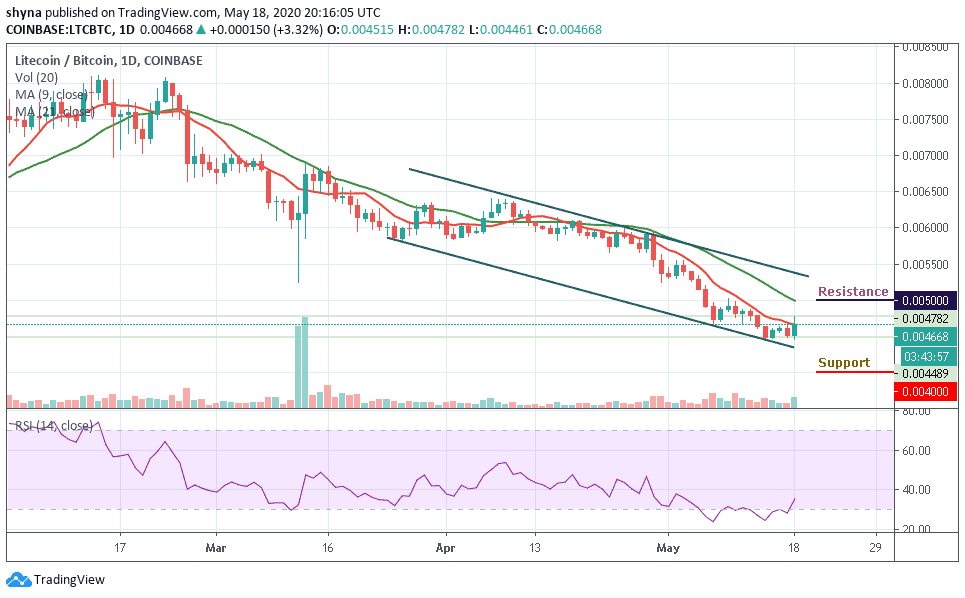
From above, if the bulls can break above 4700 SAT, higher resistance is then located at 4800 SAT. This is then followed with potential resistance levels at 5000 SAT and 5200 SAT. From below, the nearest level of support now lies below the channel. Beneath this, further support is at 4000 SAT and 3800 SAT respectively. Likewise, the RSI has broken above the 30-level which is a promising sign for the bulls as the momentum is on their side.
Please note: Insidebitcoins.com is not a financial advisor. Do your research before investing your funds in any financial asset or presented product or event. We are not responsible for your investing results.
Join Our Telegram channel to stay up to date on breaking news coverage