Join Our Telegram channel to stay up to date on breaking news coverage
Bitcoin (BTC) Price Prediction – May 18
BTC is currently consolidating and seems to be preparing for the next move either above $10,000 or towards $9,500.
BTC/USD Long-term Trend: Bullish (Daily Chart)
Key levels:
Resistance Levels: $11,000, $11,200, $11,400
Support Levels: $8,200, $8,000, $7,800
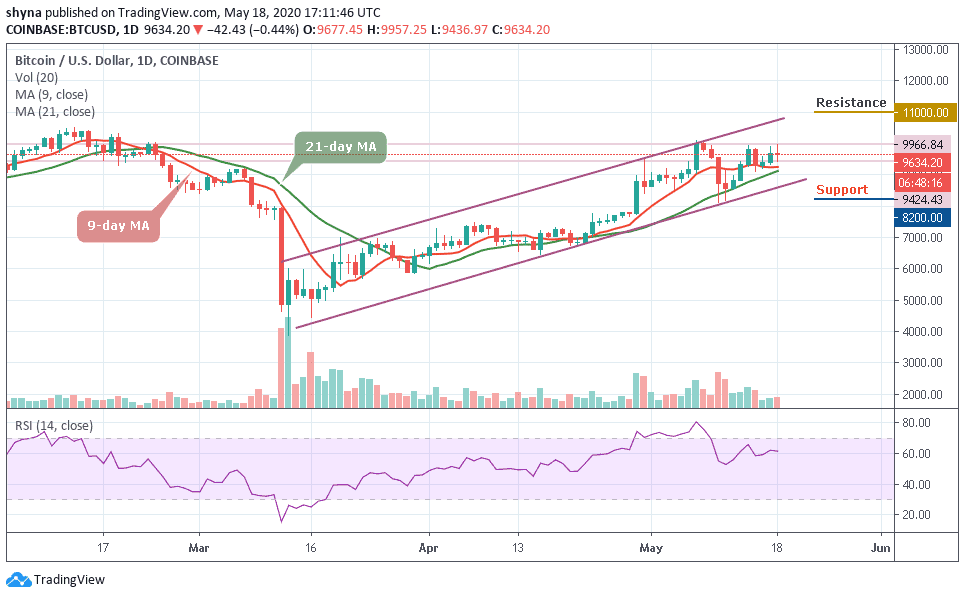
Looking at the daily chart, BTC/USD is trading at $9,634 following a minor correction from the intraday high at $9,966. The technical indicator RSI (14) clearly shows that the bulls are in control and could continue to pull the price upwards. But the same bulls are also facing their ultimate test to break the key $10,000 resistance zone. Meanwhile, if this resistance is conquered, more buyers may likely join the market in order to capitalize on a possible breakout towards the high of $10,500.
However, the Bitcoin price was rejected at the important level above $9,966; much like it was at $10,000. With $9,900 as the new psychological barrier to the Bull-run, anything below this level is a bear territory, and bulls will need to stay on their toes. Nevertheless, if a deeper correction follows here, it could be considered extremely unhealthy for the first-ever crypto asset.
Moreover, the main resistance for the bulls is near the $11,000, $11,200, and $11,400 levels. Conversely, there could be more losses if there is no break above $10,000. The main supports on the downside are near $9,500 and $9,000. If there is a downside break below $9,000, the price may accelerate decline towards the $8,200, $8,000, and $7,800 support levels. The RSI (14) is currently moving at 60.72-level and it may soon test below this level.
BTC/USD Medium-Term Trend: Bullish (4H Chart)
Looking at the 4-hour chart, BTC/USD is currently in the ascending range of the medium-term outlook as the target market has support levels of $9,200, $9,000, and $8,800. But as the downtrend continues below the 9-day moving average, the Bitcoin market is gaining momentum with the support of 21-day moving average as buyers keeping tight positions.
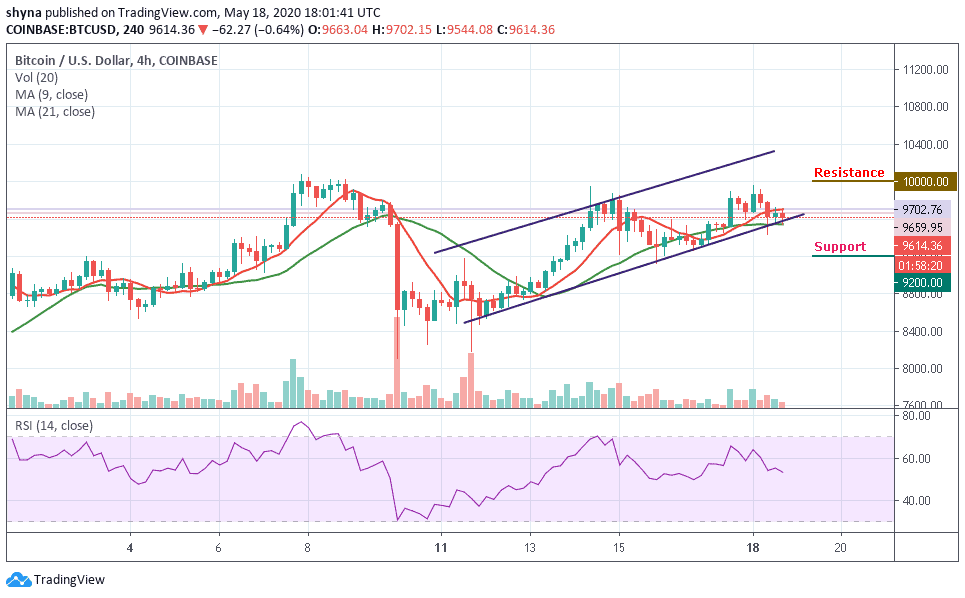
Looking at the RSI (14) indicator on the 4-hour chart, it shows that BTC price may continue to experience some slight drops for a little time before a reversal could take place. Immediately the market reverses, the buyers may likely pull the price up to $10,000, $10,200, and $10,400 resistance levels.
Please note: Insidebitcoins.com is not a financial advisor. Do your research before investing your funds in any financial asset or presented product or event. We are not responsible for your investing results.
Join Our Telegram channel to stay up to date on breaking news coverage