Join Our Telegram channel to stay up to date on breaking news coverage
LTC Price Prediction – March 28
The valuation of LTC/USD market operations appears to have declined once again in a reversal moving mode as it did between the previous trading days’ sessions of February 28 and March 1. Price is getting set to spring northbound in a near time.
LTC/USD Market
Key Levels:
Resistance levels: $210, $230, $250
Support levels: $160, $140, $120
LTCUSD – Daily Chart
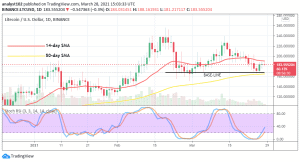
The present trading situation of LTC/USD has formed to align with having the $160 level as the point around the base-line has to be drawn. It is so, based on the fact that LTC/USD value has been unable to breach successfully to the south during the need for a price reversal move. The 50-day SMA trend-line has been placed around the support line to solidify that sentiment. And, the 14-day SMA is located over the bigger SMA with price trading closely from below. The Stochastic Oscillators have crossed from the oversold region to point northbound near below range 40. That gives the possibility of getting to see more ups in the near trading session.
Will LTC/USD market experience fast upsurges beyond the $190 resistance point?
As of writing, it has appeared that the main resistance has been built around the level of $190 making it difficult for the LTC/USD buyers to push past to the north. Meanwhile, there has been an emergence of a bullish sign giving a strong clue of the bulls coming stronger soon in the crypto-economy. A sudden loss of momentum around the $190 level may let the crypto’s worth depreciating briefly past the base-line at the $160 mark.
On the flip side, a further breakdown of the $160 trading point could create an unsafe moment for holding on to shorting positions. Ideally trading technical approach, it would be much better for the sellers to await price reaching out for a peak level to spot a retracement before launching a sell entry around an established resistance zone.
LTC/BTC Price Analysis
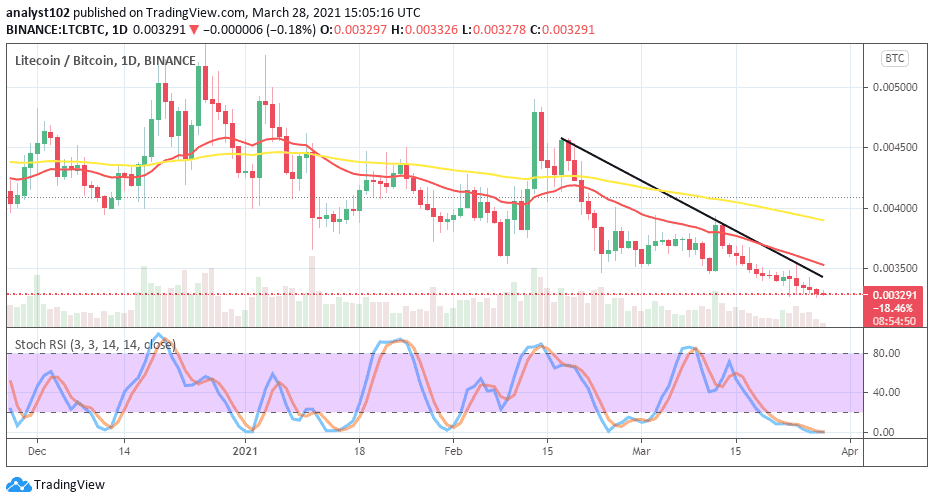
Comparing the price-worth of LTC with BTC, it is still apparent that to some degree, the counter-crypto has more purchasing power as looked against the base-trading instrument. The base-crypto has been tightly pushed southward over time even below its usual formal base-line where it used to regain its lost momentum. All the trading trend-lines are located over the crypto pairs value as the 50-day SMA is over the 14-day SMA. The Stochastic Oscillators have moved into the oversold region to consolidate within it. That shows the possibility that the pressures being inflicted on the base-crypto hasn’t been far from over.
Join Our Telegram channel to stay up to date on breaking news coverage


