Join Our Telegram channel to stay up to date on breaking news coverage
Litecoin Price Prediction – May 17
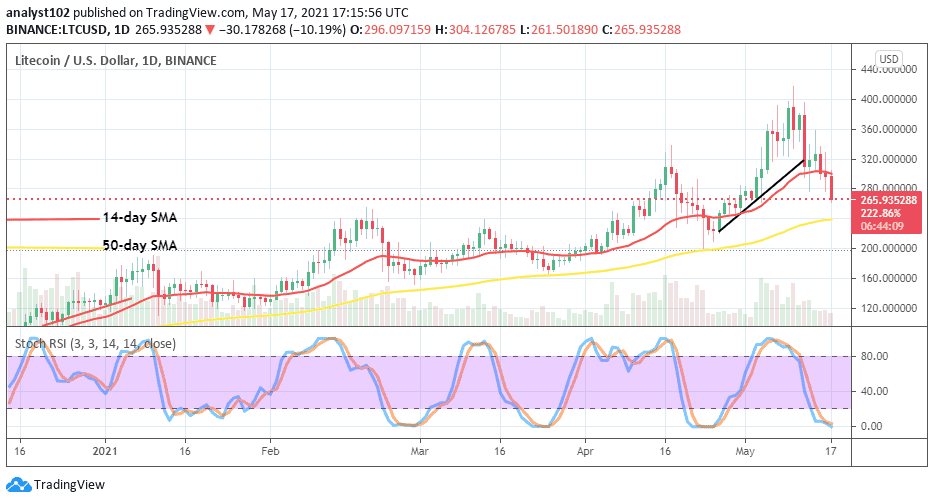
Currently, a downward correctional move is ongoing and picking up steam in the LTC/USD market. The US currency forces its worth on the crypto since May 10, while the base instrument hit resistance around a high value of $400. With about a 10.07% reduction presently in the crypto market, the LTC price now trades at around the level of $266.
LTC/USD Market
Key Levels:
Resistance levels: $320, $360, $400
Support levels: $240, $220, $200
LTC/USD – Daily Chart
The LTC/USD daily chart showcases a heavy downward price correctional movement as most of the vital support trading levels breached to the downside. An intense bearish candlestick is being formed in the space between the SMAs. That has led to the breaking down of the bullish trend-line and the 14-day SMA trend-line to the south.
The 50-day SMA indicator is being approached by current falling pressure at the immediate support value of $240. The Stochastic Oscillators are now in the oversold region slightly pointing to the south within it. That still calls for placing position with cautiousness as there may soon be a change of trend in no time.
Litecoin Price prediction: Will the LTC/USD current fall-off reach for support of $240?
Going by the current pace at which the LTC/USD market operations as regards the downward correctional moves, it is most likely that bulls will await price to either closely average or briefly touch past the immediate support level of $240 before considering launching a pull-up. That said, a bullish candlestick formation is needed to back up a reliable return of an upward move at that trading zone.
On the account of contradiction, as regards the market’s upside, bears would now have to consolidate their stance in the market to forcefully break down the $240 support level in a continuation southward pushes to see through some lower support trading lines. The smaller SMA indicator may not play along with the furtherance of downswing at the first instance of heightening pressure.
LTC/BTC Price Analysis
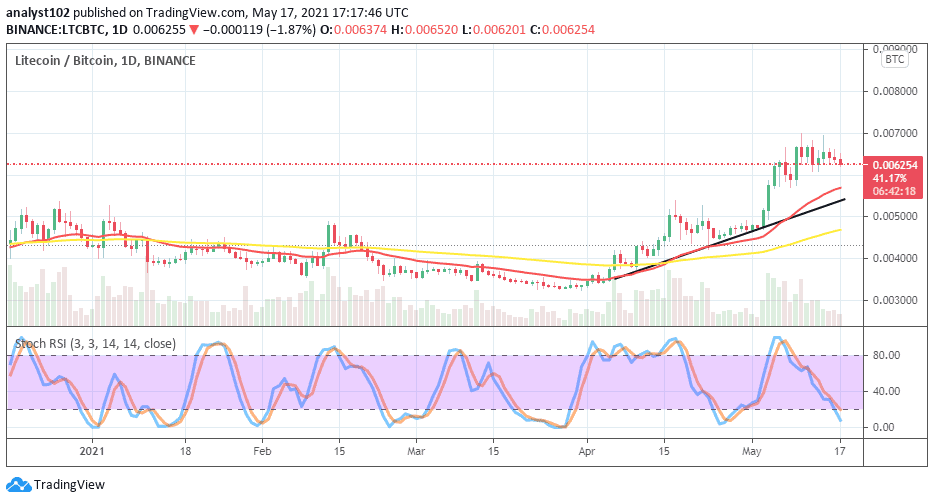
In this Litecoin price prediction we see that the comparison between trading volume outlook for LTC and BTC as shown on the chart depicts that the counter instrument has only been able to hold back the base tool in a convergent trading cycle at higher zones. Yet, the trend is having it to favor of LTC as placed with BTC.
The 14-day SMA trend-line and the bullish trend-line are over the 50-day SMA. And, they are all underneath the cryptos’ trading point. The Stochastic Oscillators have slantingly moved into the oversold region with a brief-pointing posture to the south. That indicates that the possibility that the base instrument may soon begin a push further to the north.
Join Our Telegram channel to stay up to date on breaking news coverage


