Join Our Telegram channel to stay up to date on breaking news coverage
LTC Price Prediction – March 29
The Litecoin (LTC) price was seen following a bearish movement within the ascending channel.
LTC/USD Market
Key Levels:
Resistance levels: $45, $47, $49
Support levels: $30, $28, $26
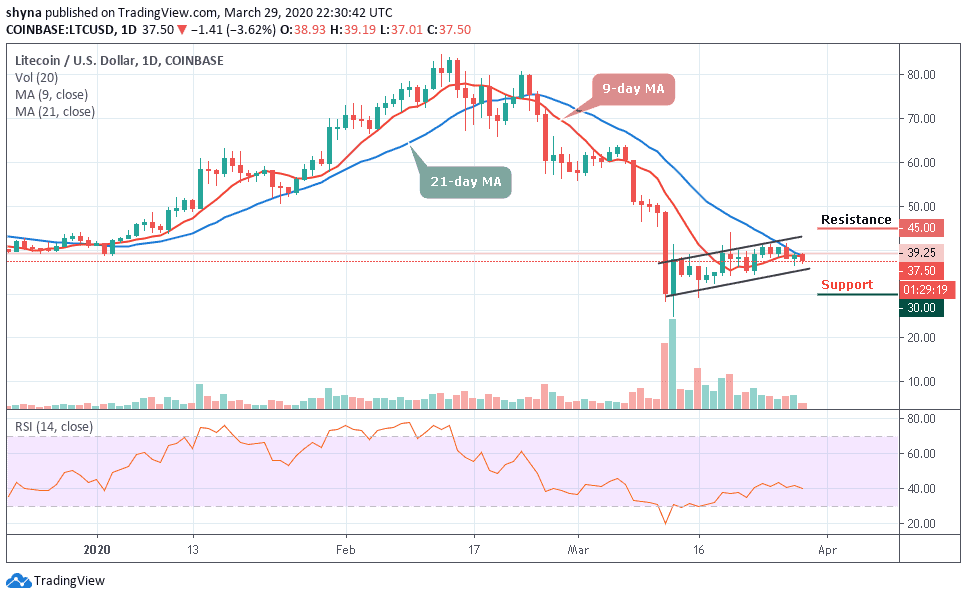
LTC/USD fell from $39.25 to $37.50 so far as the downward trending line acts as market resistance. The price dropped below the support provided by the 9-day and 21-day moving averages. The $35 support line needs to be defended by the bulls to prevent further downward movement but the technical indicator moves in the same direction, hinting that even further price may follow a sideways movement.
However, the longer the pair fails to rally from its current trading levels, the greater the chance that we may see the cryptocurrency falling to a new trading low. A break below the $35 support level may provoke an even deeper decline towards the $30, $28 and $26 levels. Short-term technical analysis shows that the $34 and $32 levels are currently the strongest forms of technical support before the $31 level may come into play.
Moreover, the daily chart highlights that the LTC/USD pair’s 9-day moving average, at the $39.48 level, is a key technical region which bulls need to break. More so, we may need to see a sustainable move above this level to retest $43 level. The ultimate bulls’ goal is created above the ascending channel at $45, $47 and $49 resistance levels.
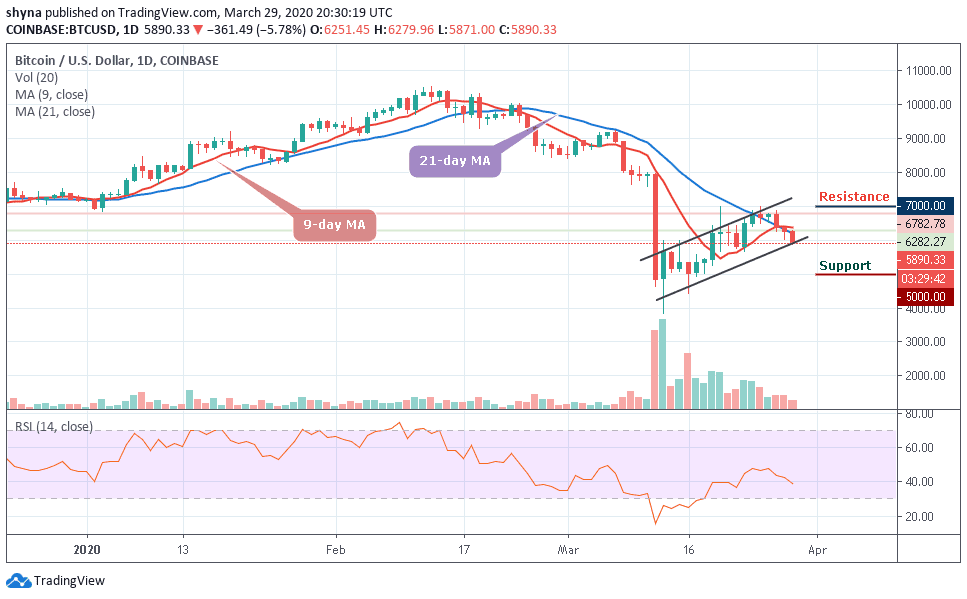
Against Bitcoin, looking at the chart, the bulls are making effort to step back into the market by halting the downtrend. More so, the coin is trying to show some promising signs that could make higher highs should it continue to move above the 9-day and 21-day moving averages. From the upside, the nearest level of resistance lies at 6900 SAT, above this, higher resistance lies at 7000 SAT and 7100 SAT.
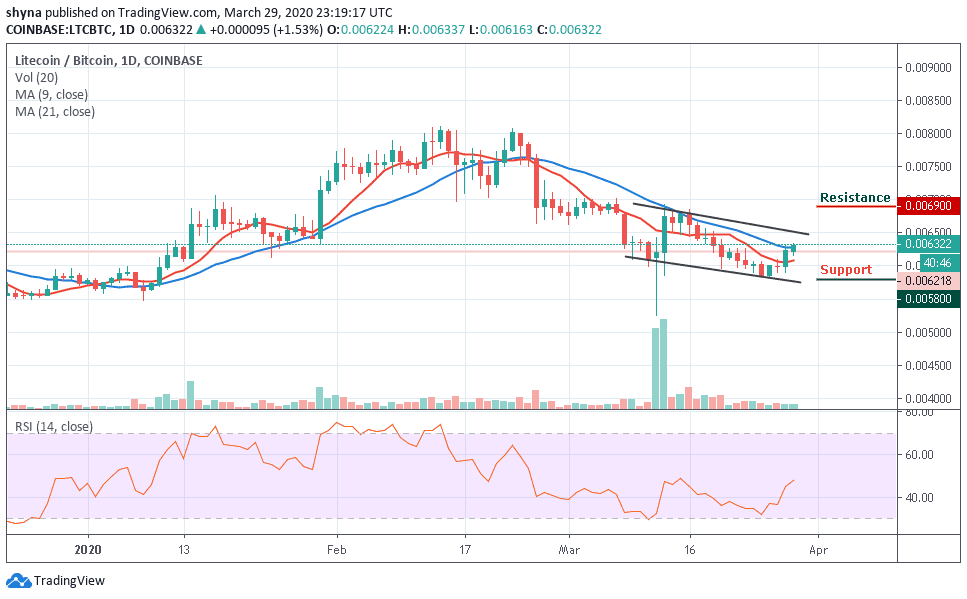
Furthermore, from downside; the nearest levels of support are 6200 SAT and beneath this, further support lies at 6000 SAT. If the price drops further to create a new low, lower support is located at 5800 SAT, 5700 SAT, and 5600 SAT. The RSI (14) is making an attempt to break above the 48-level which shows that the bulls are in control.
Please note: Insidebitcoins.com is not a financial advisor. Do your research before investing your funds in any financial asset or presented product or event. We are not responsible for your investing results.
Join Our Telegram channel to stay up to date on breaking news coverage