Join Our Telegram channel to stay up to date on breaking news coverage
Bitcoin (BTC) Price Prediction – March 29
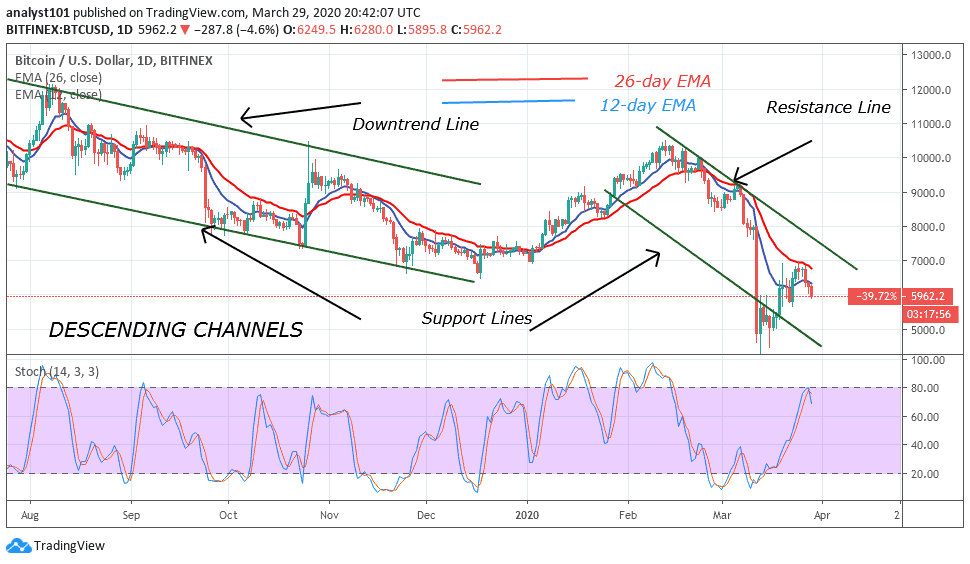
Bitcoin (BTC) shows a heavy pullback today as it has affected the majority of other cryptos within the market.
BTC/USD Long-term Trend: Bullish (Daily Chart)
Key levels:
Resistance Levels: $7,000, $7,200, $7,400
Support Levels: $5,000, $4,800, $4,600
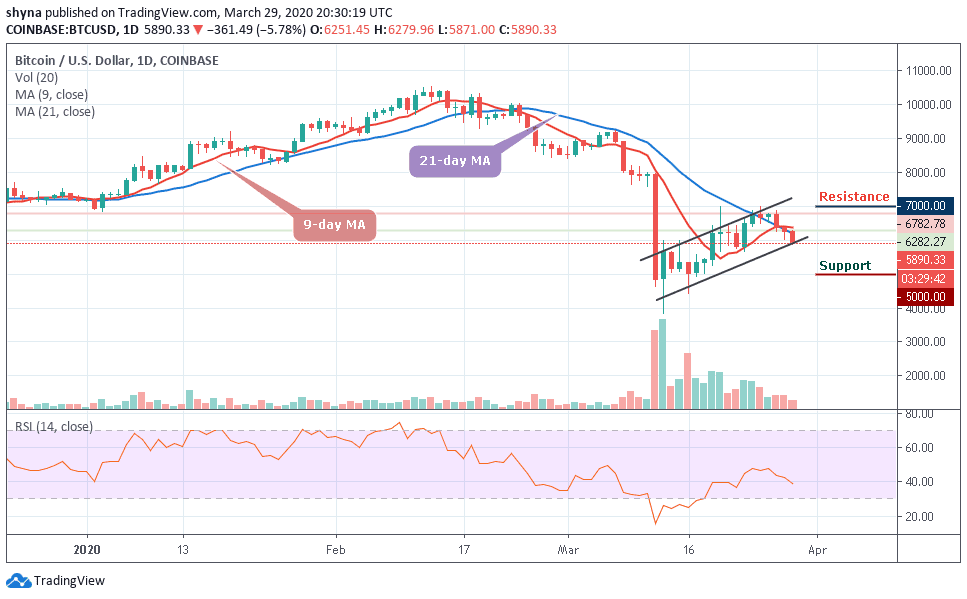
Looking at the daily chart, BTC/USD is falling below $6,000 with a loss of around 5.78% from the opening price to reach the $5,890 level at the time of writing. More so, the cryptocurrency previously experienced resistance at $6,800, which caused it to reverse and fall within the past 3 days. Such a noticeable drop in prices has raised doubts among the cryptocurrency community, as the drop has affected other cryptos at the moment.
Moreover, BTC/USD has now dropped beneath the previous rising price channel as the bearish case increases. It does look like Bitcoin might be headed back toward $5,000 over the next 2-weeks of trading if it breaks beneath $5,500 within the next few days to end this month. Taking a look at the daily chart, we can clearly see Bitcoin struggling at the $6,000 level which caused it to roll over and drop.
However, the coin attempted to find support around the 21-day MA within the channel but failed to hold this level and dropped beneath this support in today’s trading session. BTC/USD remains neutral but it is in extreme danger of turning bearish if it breaks beneath $5,500. If this is the case, traders can expect support toward the downside at $5,000, $4,800 and $4,600 support levels as the RSI (14) crosses below 40-level. On the other side, resistance lies at $7,000, $7,200 and $7,400 levels. `
BTC/USD Medium-Term Trend: Bearish (4H Chart)
At the opening of the market today, the Bitcoin price is seen following the downward trend, bringing its price from $6,247 to reach around $5,929. If the price continues to drop further and move below the channel, it could reach the nearest supports at $5,500, $5,300 and $5,100 respectively.
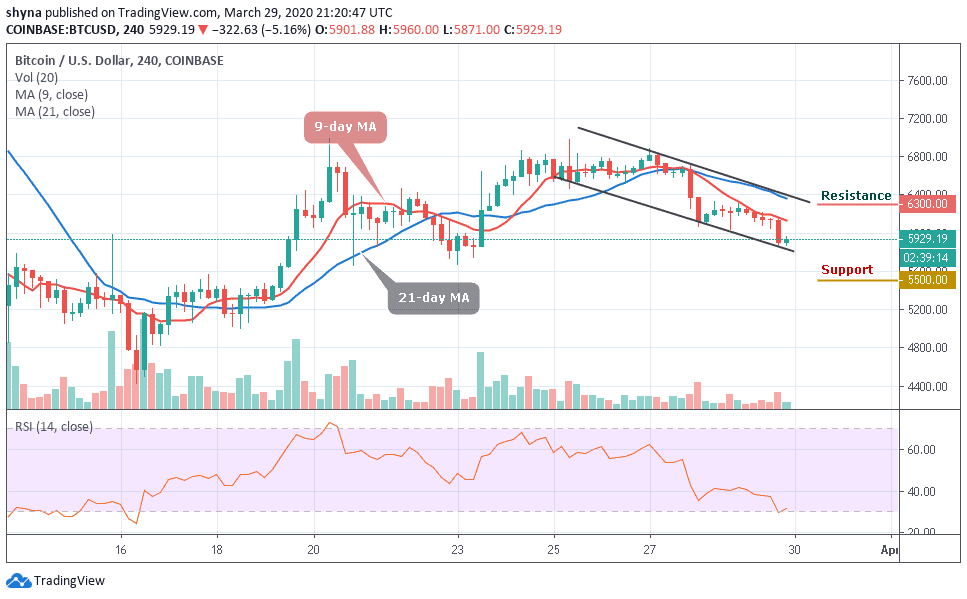
Moreover, if the bulls push the coin above the 9-day and 21-day moving averages, the price of Bitcoin may likely reach the potential resistance levels of $6,300, $6,500 and $6,700 as the technical indicator RSI (14) is making a sharp movement above 30-level.
Please note: Insidebitcoins.com is not a financial advisor. Do your research before investing your funds in any financial asset or presented product or event. We are not responsible for your investing results.
Join Our Telegram channel to stay up to date on breaking news coverage