Join Our Telegram channel to stay up to date on breaking news coverage
LTC Price Prediction – April 13
The Litecoin price managed to fend off $40 for now but the bearish signals are still very much around.
LTC/USD Market
Key Levels:
Resistance levels: $50, $52, $54
Support levels: $32, $30, $28

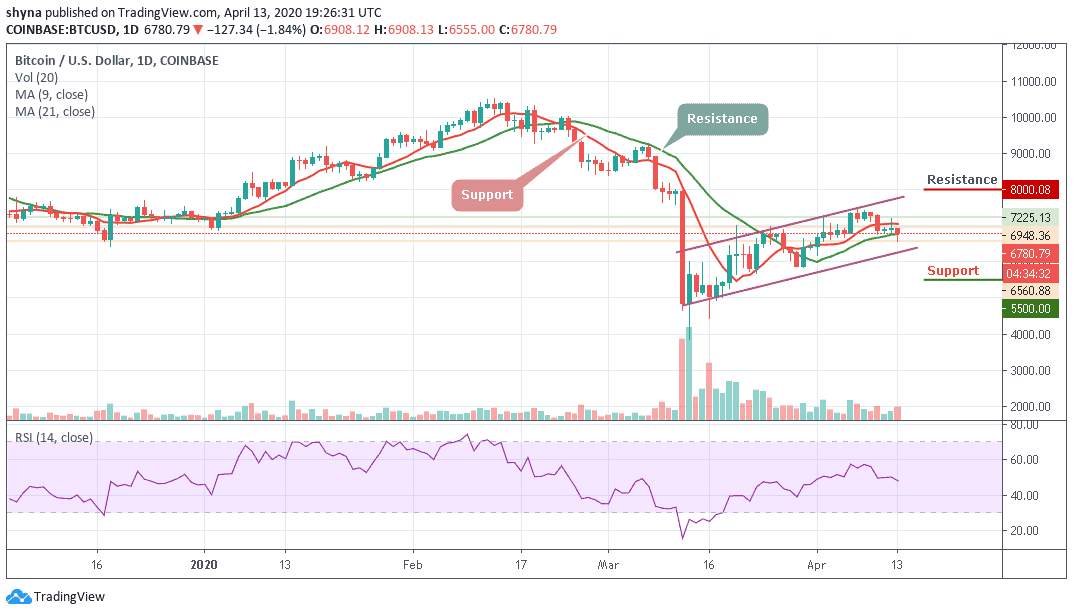
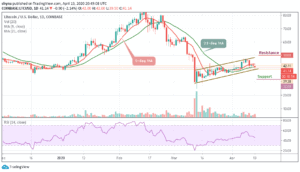
Today, LTC/USD has been looking bearish as the price tested and printed below $40 to touch the low of $39.38 support level. The price is also trading under both 9-day and 21-day moving averages within the ascending channel. Looking at the indicators now the RSI has moved into the bearish territory by moving around 46-level. The volume has also picked up as the selling kicked in. Therefore, $40 will now be the main level of support that needs to be watched.
Moreover, a few days ago, LTC/USD started with a trading price of about $46.51 and closed the day with $42.53. Today, the market opened without any rise after which the bears grabbed the price and dragged it below the point where it closed the trading of a few days ago. With this fall, the coin might not be able to maintain its effectiveness before showing some signs of downward trends.
However, the intraday movement of the coin is quite unstable, but starting at $41.14, a rebound may likely occur and if the bulls can put more effort to push the Litecoin price to cross above the 9-day moving average and the upper boundary of the channel. The potential resistances to watch are $50, $52 and $54 while the supports are $32, $30 and $28 levels.
Against Bitcoin, the Litecoin performance has been very low due to a bearish recurring. The pair has already dropped below the 9-day moving average and it may likely see another sharp drop at 5900 SAT support level. Breaking this level could further drag the market to the nearest support levels at 5600 SAT, 5400 SAT, and 5200 SAT.
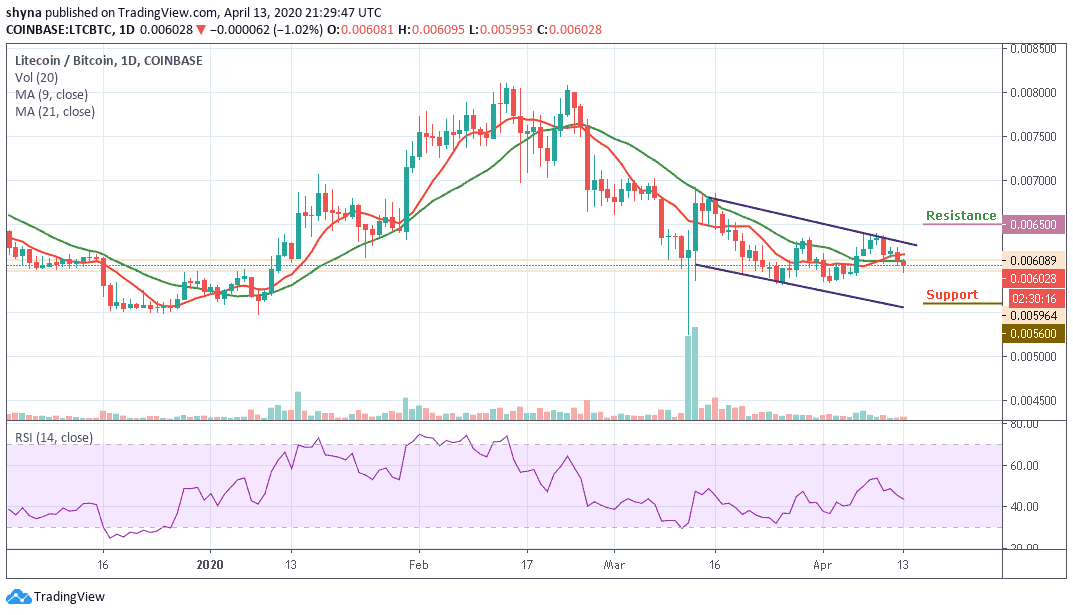
However, LTC/BTC is currently changing hands at 6028 SAT but if the bulls can hold the price tight and move above the 9-day moving average to break out of the channel, the next key target price may likely be at 6300 SAT respectively. Reaching this level might move it to the potential resistance at 6500 SAT and above. Meanwhile, the RSI (14) is dropping towards the 40-level; possible selling pressure is likely if it continues like this.
Please note: Insidebitcoins.com is not a financial advisor. Do your research before investing your funds in any financial asset or presented product or event. We are not responsible for your investing results.
Join Our Telegram channel to stay up to date on breaking news coverage