Join Our Telegram channel to stay up to date on breaking news coverage
Bitcoin (BTC) Price Prediction – April 13
After multiple failures to clear the $7,500 resistance area, the Bitcoin price reacted to the downside.
BTC/USD Long-term Trend: Bullish (Daily Chart)
Key levels:
Resistance Levels: $8,000, $8,200, $8,400
Support Levels: $5,500, $5,300, $5,100

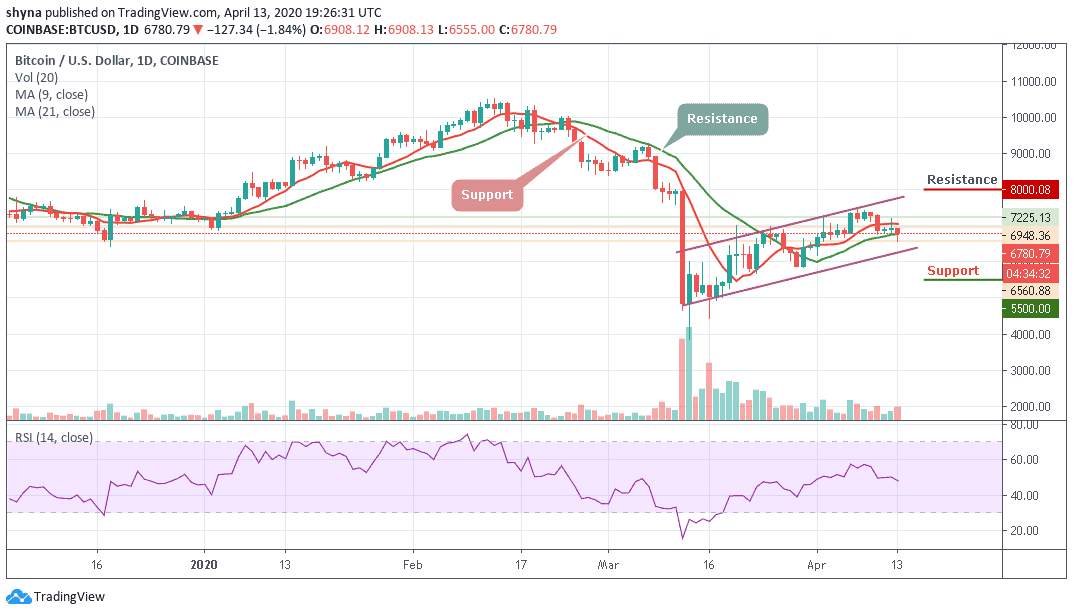
In the past few hours, BTC/USD saw an increase in selling pressure after it failed to overcome key resistance levels near $7,400. BTC/USD declined more than 1.80% and broke the $7,200 and USD 7,000 support levels. It is now trading below $6,800, with immediate support at $6,700. Any further losses could lead the price towards the $5,500, $5,300 and $5,100 support levels.
More so, BTC/USD is struggling to recover the losses by climbing higher above the $6,700 after touching the low of $6,560 at the opening of today’s market. The coin is currently trading above the 9-day and 21-day moving averages. Typically when the new uptrend movements are beginning to form, buyers will use the moving averages as the nearest support levels.
However, as much as the red-line of the 9-day moving average is above the green-line of the 21-day moving average, the market may still remain in the upward movement. But looking at the daily chart, the resistance levels to watch are $8,000, $8,200 and $8,400 respectively. Meanwhile, the technical indicator RSI (14) moves below 48-level, suggesting more bearish signals.
BTC/USD Medium-Term Trend: Bearish (4H Chart)
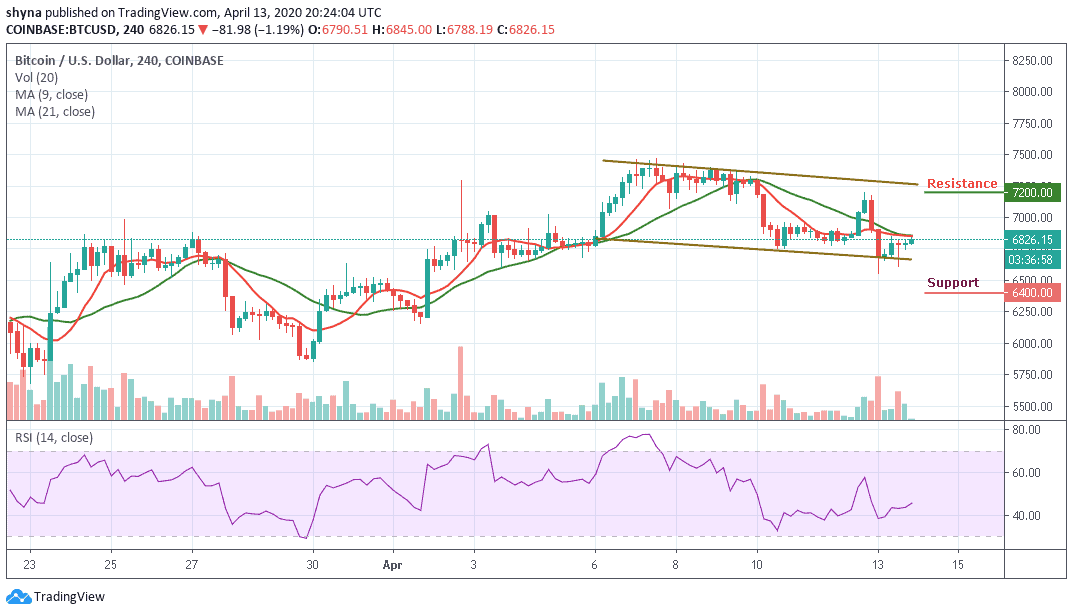
If you look at the 4-hour chart, the Bitcoin price is still under $7,000 and could continue to weaken if the price continues to fall below the 9-day and 21-day moving averages. However, once the current correction is completed, it may likely reach $6,400 or $6,200 while the price could allow a decent recovery.

Similarly, the technical indicator RSI (14) chart shows an upward price momentum, as it is in the bearish zone and the signal line is around the 45-level. The BTC/USD may experience further resistance of $7,200 and $7,400 levels if it raises the much-needed price recovery above $7,000.
Please note: Insidebitcoins.com is not a financial advisor. Do your research before investing your funds in any financial asset or presented product or event. We are not responsible for your investing results.
Join Our Telegram channel to stay up to date on breaking news coverage

