Join Our Telegram channel to stay up to date on breaking news coverage
LTC Price Prediction – July 27
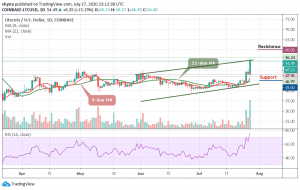
The Litecoin marks an intraday bullish move as the coin trades around an imminent price area at $54.
LTC/USD Market
Key Levels:
Resistance levels: $60, $65, $70
Support levels: $45, $40, $35
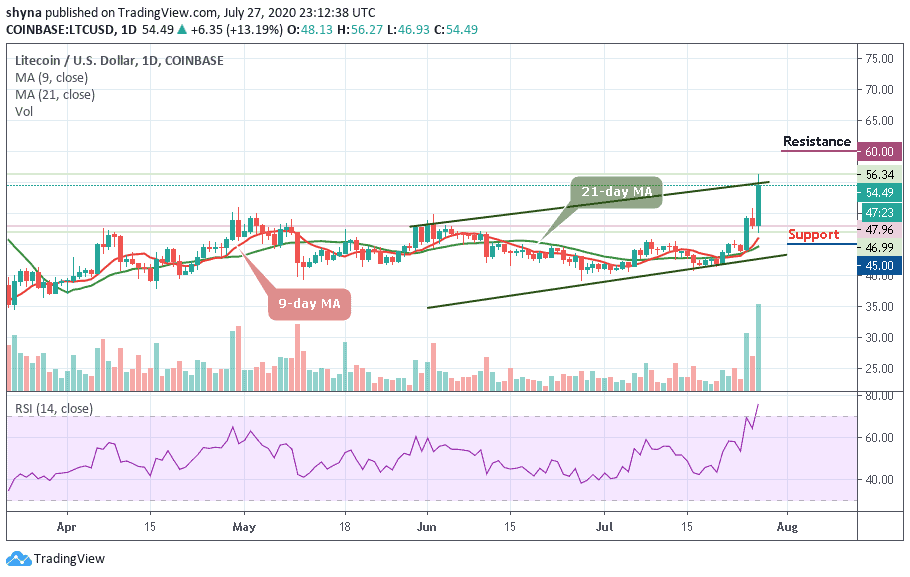
LTC/USD is currently showing a positive movement over the past few days. The market is actually running a little retracement move towards $56 with a growth of 13.19%. Aside from today’s gain, Litecoin (LTC) is still maintaining an upward movement within the ascending channel. We can expect the price to continue to rise as soon as the bulls put more pressure on the market.
However, if the market price can keep respecting the upward movement, then, traders may expect a bullish continuation after testing the $50 support level. As the technical indicator reveals within the daily chart, the RSI (14) signal line is moving into the overbought region, the next level of resistance may likely be $60, $65, and $70 in the long-term.
In other words, looking at the price formation, a bearish breakout may likely play out for this market. Nevertheless, LTC/USD may follow a bearish movement in the short-term and a bearish extension could roll the coin back to the long-term support at $45, $40, and $35 levels. In addition, a continuous price-fall might further lead to a violent break below $30 support level.
Against Bitcoin, Litecoin (LTC) is ranging on the long-term outlook. The pair has formed a horizontal channel within the daily chart. Meanwhile, the sideways movement continues in LTC/BTC market on the chart at around 4858 SAT respectively.
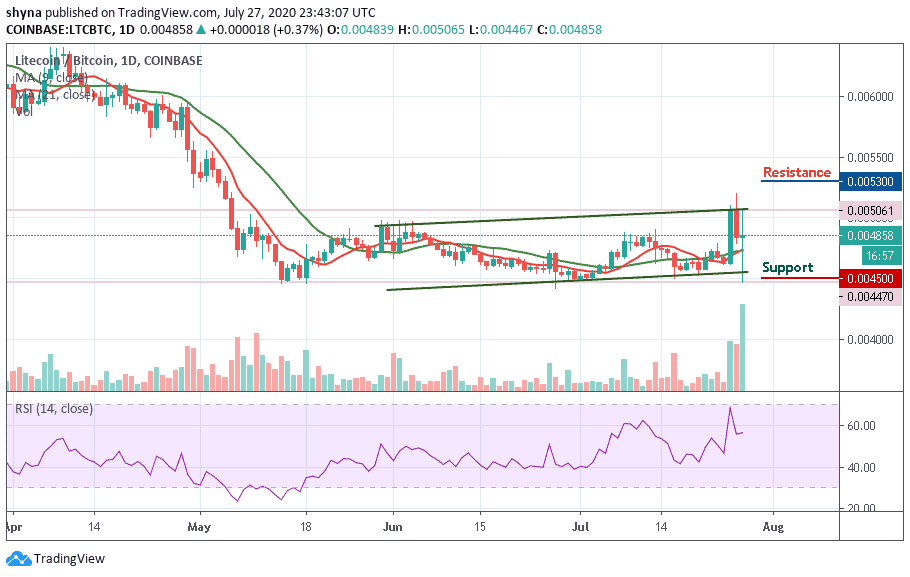
However, if the Litecoin price decided to climb in a bullish movement, it could touch the resistance levels at 5300 SAT and 5400 SAT. Similarly, traders interested in the coin should have a long term period. The coin may generate considerable profits on investments made during the same period.
The RSI indicators show that it is possible for the market to follow a sideways movement and any bearish movement below the moving averages may likely hit the support level at 4500 SAT and 4400 SAT respectively.
Join Our Telegram channel to stay up to date on breaking news coverage