Join Our Telegram channel to stay up to date on breaking news coverage
LTC Price Prediction – November 2
Litecoin (LTC) is seen to be caught between the bull and the bear, while the price of the cryptocurrency fluctuates sideways.
LTC/USD Market
Key Levels:
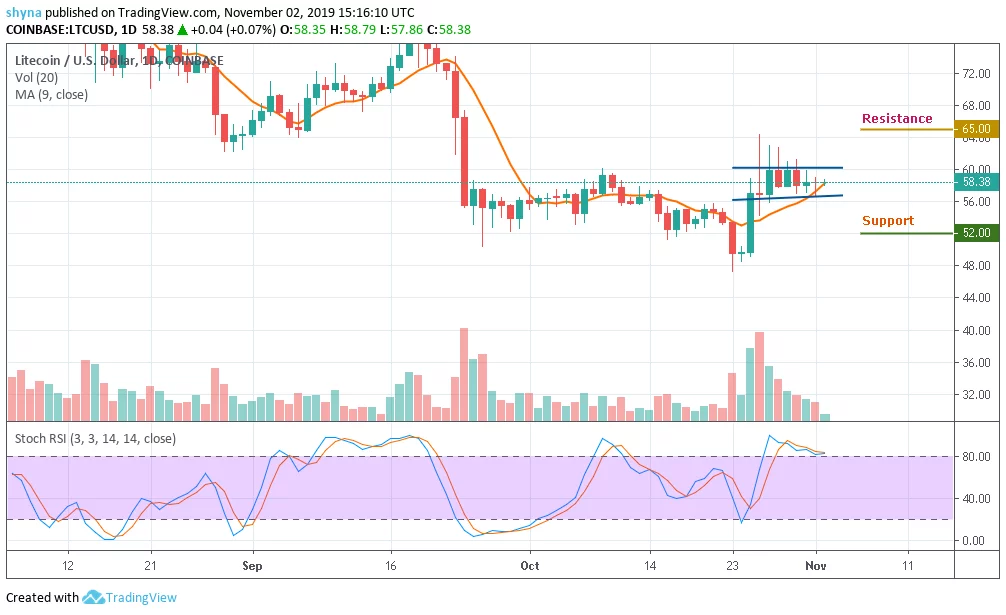
Resistance levels: $65, $70, $75
Support levels: $52, $42, $32
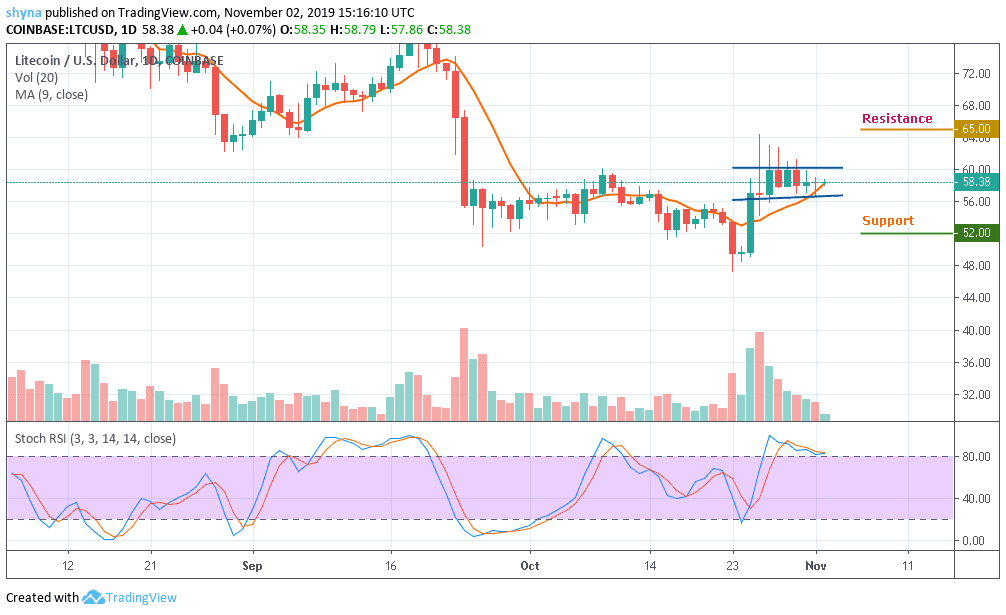
Looking at the daily chart, LTC/USD is still defending the support level of $55 again as the price hovers around $58. The coin is now moving around the moving average, with a period of 9 indicating a sideways movement. For the time being, the market price is moving within the channel and the stochastic RSI indicator may be issuing some bearish signals.
Taking a look at the market, the LTC coin is yet to show a strong bear dominance in the long-term. But the short-term outlook looks bullishly strong. However, a bullish interception may set the next key resistance at $65, $70, and $75, crossing the upper boundary. Nevertheless, we could experience a little rise before the rally begins.
Following the on-going movement, the price of Litecoin has recently plunged to $57 before a small rise to where it’s currently changing hands at $58.38. A further rally is likely at $52, $42 with a possible new monthly low at $32. As we can see on the daily price chart, LTC volume has been drastically low over the past days, which shows the bears may soon step back into the market.
With Bitcoin comparisons, the market has evolved for a while in a very different way. But currently, the best trading platforms of cryptocurrency, sellers and buyers are trying to decide who will control the market but currently moving under the 9-day MA and towards the lower boundary of the channel while the stochastic RSI is maintaining the level 38.
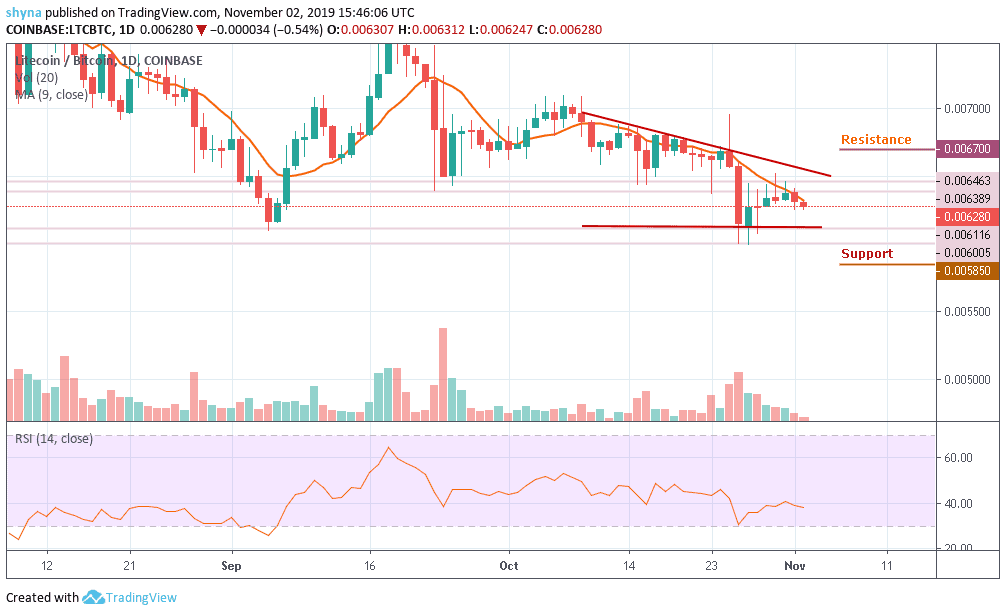
However, the downtrend is seen giving the sellers the confidence to increase their entries. More so, if the bears succeeded in the broken price, one would expect the market to fall to the support level of 5850 SAT and 5750 SAT. Meanwhile, a rebound could increase it to the 6700 SAT and 6800 SAT BTC resistance level
Please note: Insidebitcoins.com is not a financial advisor. Do your research before investing your funds in any financial asset or presented product or event. We are not responsible for your investing results.
Join Our Telegram channel to stay up to date on breaking news coverage