Join Our Telegram channel to stay up to date on breaking news coverage
LTC Price Prediction – January 23
LTC/USD bulls must protect the $52 support line to prevent further downward movement.
LTC/USD Market
Key Levels:
Resistance levels: $64, $66, $68
Support levels: $48, $46, $44
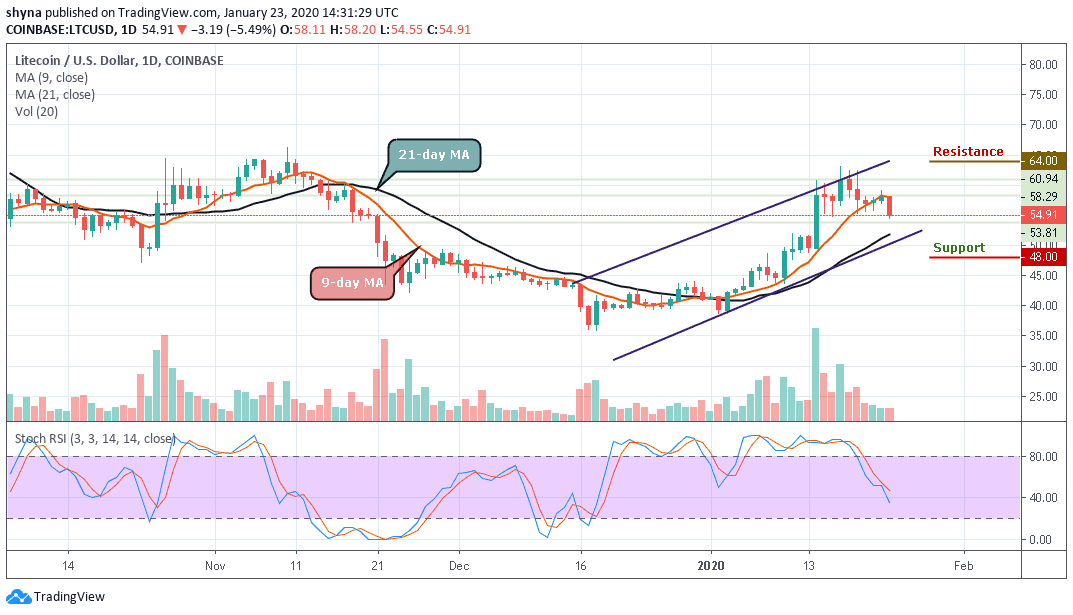
LTC/USD fell from $58.29 to $54.91 so far this Thursday as the downward trending line acts as market resistance. The price dropped below the support provided by the 9-day moving average curve. The $54.14 support line needs to be defended by the bulls to prevent further downward movement. The stochastic RSI indicator dropped from 51.71 to 36.32, hinting that even further price drop may be around the horizon.
However, the longer that the LTC/USD pair fails to rally from current trading levels, the greater the chance that we may see the cryptocurrency falling to a new trading low. A break below the $50 support level may provoke an even deeper decline towards the $48, $46 and $44 levels. Short-term technical analysis shows that the $53 and $51 levels are currently the strongest forms of technical support before the $49 level starts to come back into focus.
Moreover, the daily chart highlights that the LTC/USD pair’s 9-day moving average, at the $58.29 level, is a key technical region which bulls need to break. More so, we may need to see a sustainable move above this level to retest $60 level. The ultimate bulls’ goal is created above the ascending channel at $64, $66 and $68 resistance levels.
Furthermore, the stochastic RSI for Litecoin is currently facing the south due to the past few days of bearish action in the market. If the bulls can regroup, the oscillator may climb back.
When compared with BTC, the price in Litecoin is moving in sideways around 9-day moving average. The seventh-largest crypto on the market cap is yet to define its real direction because the market movement has remained clouded by more red candles than green for the past few days.
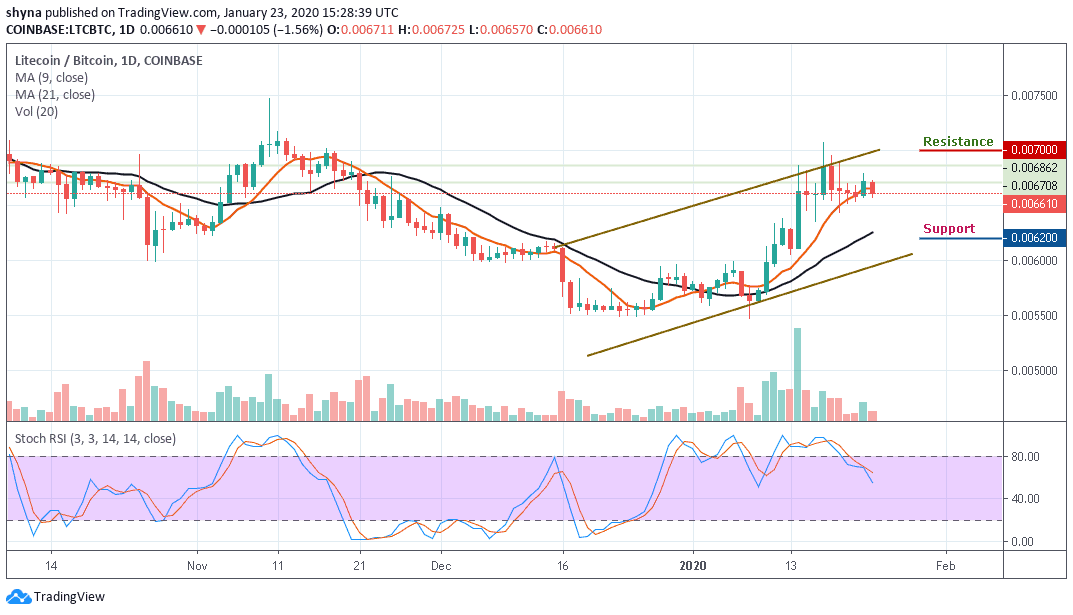
However, as the stochastic RSI nosedives to 55-level, a bearish step back may likely roll the market back to the support of 6400 SAT with a possible break below the 21-day moving average and further declines could be at 6200 SAT and below, which may establish a new weekly low for the market. Meanwhile, any bullish movement above the trend line may hit the resistance levels of 7000 SAT and above.
Please note: Insidebitcoins.com is not a financial advisor. Do your research before investing your funds in any financial asset or presented product or event. We are not responsible for your investing results.
Join Our Telegram channel to stay up to date on breaking news coverage