Join Our Telegram channel to stay up to date on breaking news coverage
LTC Price Prediction – May 3
There has been a continual moving process in the LTC/USD trade worth since it eventually found support around a lower trading point of $200 during the last correctional movement in the crypto-economy.
LTC/USD Market
Key Levels:
Resistance levels: $300, $320, $340
Support levels: $240, $220, $200
LTC/USD – Daily Chart
The LTC/USD daily trading chart now features a succession of the serial bullish candlestick to denote that the crypto’s value is on an intense moving effort to rally against the worth of the US Dollar until the present. The 14-day SMA trend-line is underneath the trading zone of the market as the bullish trend-line drew below it in a supportive format with a small space between them. And, the 50-day SMA indicator is playing its supportive role far below both of them a bit over the $200 line. The Stochastic Oscillators are tempting moving into the overbought region with theirs pointing towards the north. That suggests that some degree of upward swinging is ongoing in the market.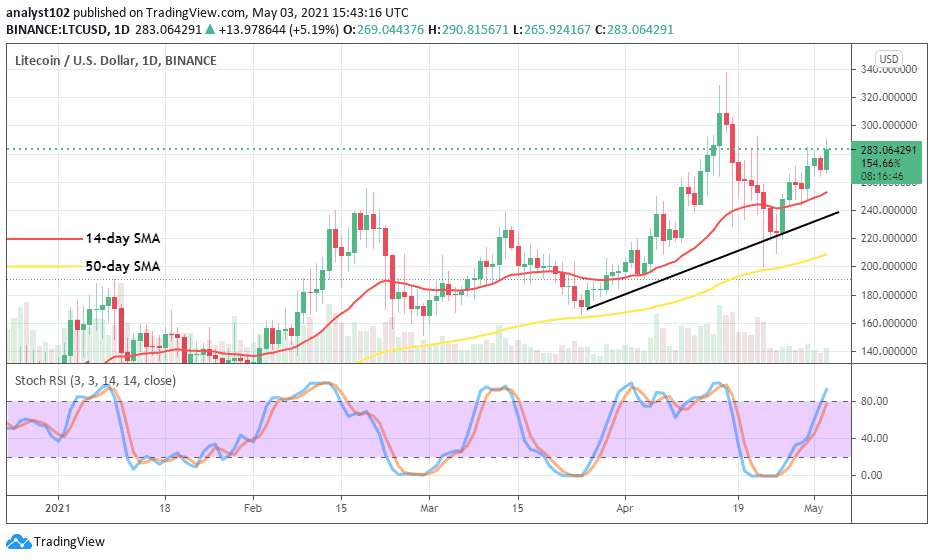
Will the LTC/USD trade not experience another correction below the level of $300 soon?
The current ongoing recovery moving outlook has reached one of the past previous around the high-level of $280. The LTC/USD bulls now more than ever, need to put efforts to push strongly past the key $300 resistance level in the next session. As regards that price value, a line of higher lows may occur to cause a dicey trading situation in the furtherance of the crypto market’s journey to the north.
On the downside, bears need to exercise some amount of patience as launching a sell position as of now in the market may summarily end up being whipsawed in the near time. Meanwhile, a strong reversal move between the resistance values of $300 and $320 may potentially bring back a small correction in the crypto’s worth.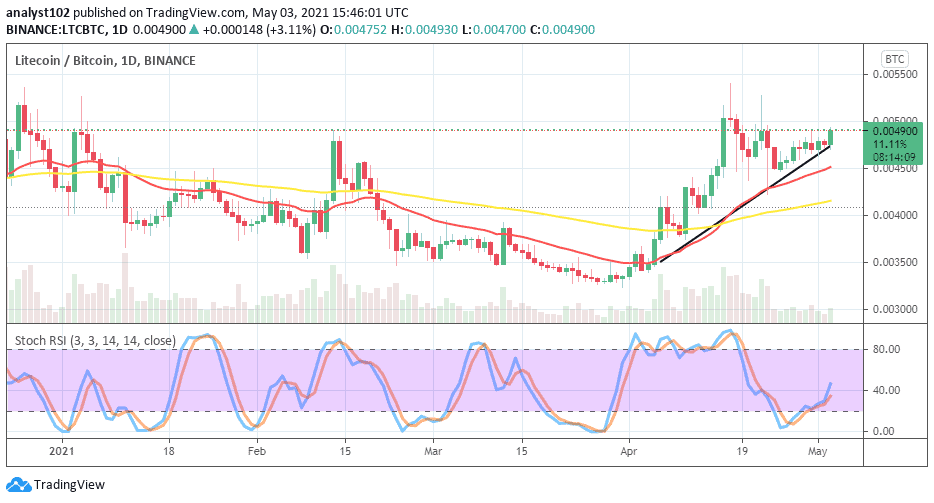
LTC/BTC Price Analysis
About a couple of days, it shows on the chart that the market weight between LTC and BTC appears to be challenged by the counter trading tool at a high trading zone that the base crypto has taken price. The 14-day SMA trend-line is situated above the 50-day SMA indicator pointing towards the north underneath the trading zone of the cryptos. The Stochastic Oscillators have moved from the oversold region to point towards the north at range 40. That signifies the possibility of seeing LTC gaining prevailing further as compared with BTC in a near session.
Join Our Telegram channel to stay up to date on breaking news coverage