Join Our Telegram channel to stay up to date on breaking news coverage
Bitcoin (BTC) Price Prediction – May 3
Today, the Bitcoin (BTC) bulls moved against the USD at numerous levels which almost touched $59,000.
BTC/USD Long-term Trend: Ranging (Daily Chart)
Key levels:
Resistance Levels: $64,000, $66,000, $68,000
Support Levels: $51,000, $49,000, $47,000
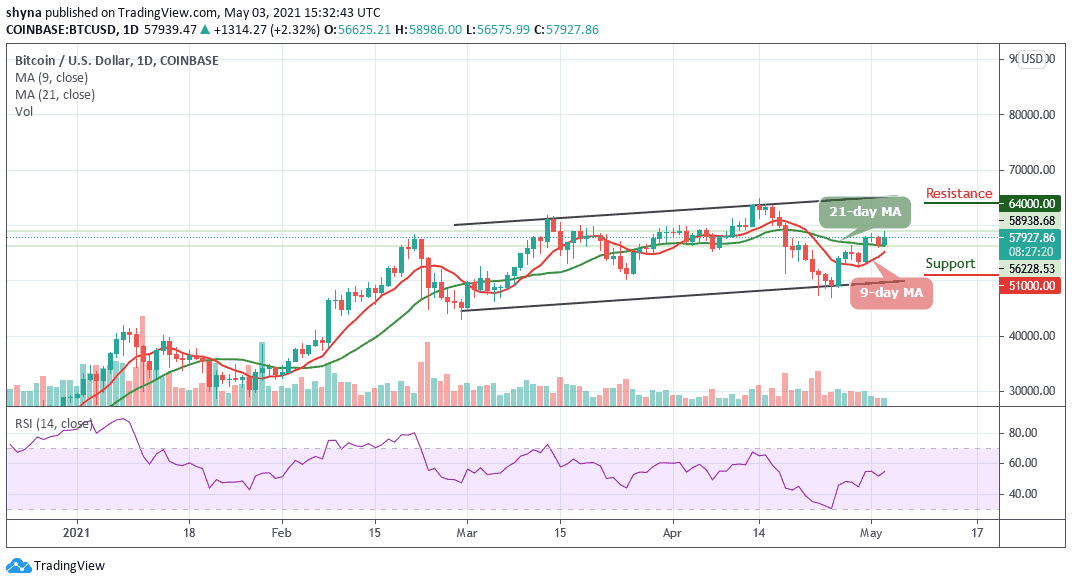
BTC/USD is resuming its upward movement after a brief dip yesterday bringing the price from $56,625 to $58,986. A couple of days ago, BTC/USD hit just over $58,500 before retreating to a local low of around $56,072 yesterday. However, the price of the leading crypto asset is now heading towards the north, in fact, it has returned to above the price levels seen a couple of days ago.
What is the Next Direction for Bitcoin?
The price of Bitcoin is now moving above the crucial levels which may now function as the support zones in the event a reversal occurs. On the upside, as the coin moves and prepares to break out of the channel, little is in place to prevent correction targeting the key resistance of $59,000 as the technical indicator RSI (14) moves above the 50-level.
Nevertheless, the king coin is banking on the support at $55,000 to ensure that in spite of a reversal, the Bitcoin price stays above the $59,500 level. Similarly, the nearest resistance levels to watch are $64,000, $66,000, and $68,000 while the support levels to keep an eye on are 51,000, $49,000, and $47,000 respectively.
BTC/USD Medium – Term Trend: Bullish (4H Chart)
The 4-hour chart shows that the price is on its way down as the RSI (14) is seen crossing below the 55-level to confirm the downtrend. Although bulls have been keeping the upward movement for some time now, the market may likely experience more downtrends if the price slides below moving averages.
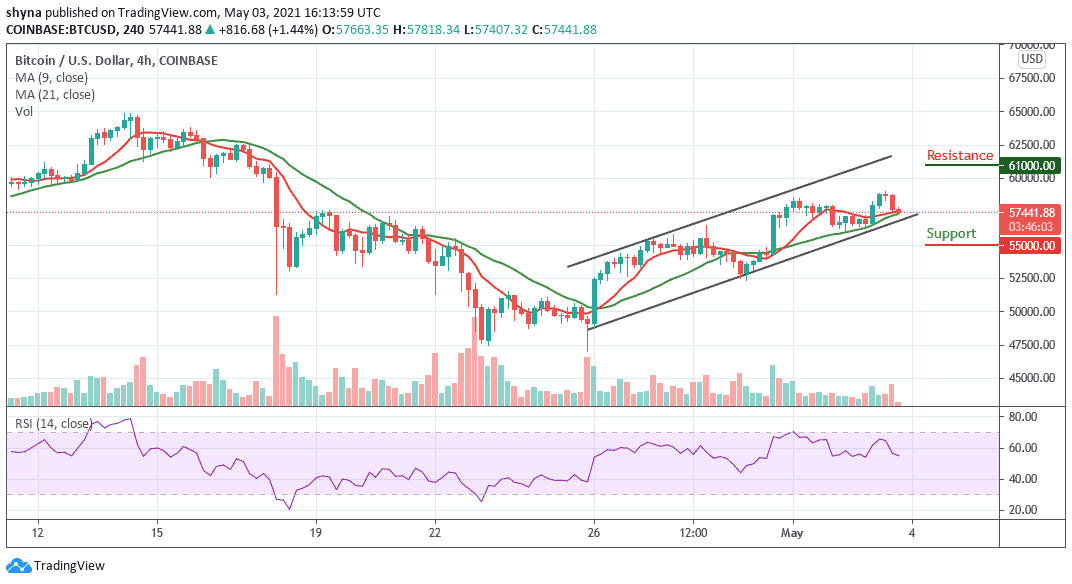
Meanwhile, the support levels of $55,000 and below may come into play if the price breaks below the lower boundary of the channel. But if the buyers can gather enough momentum to power the market; they can push the price towards the upper boundary of the channel where it could hit the targeted resistance levels of $61,000 and above.
Join Our Telegram channel to stay up to date on breaking news coverage