Join Our Telegram channel to stay up to date on breaking news coverage
Litecoin (LTC) Price Prediction – August 15
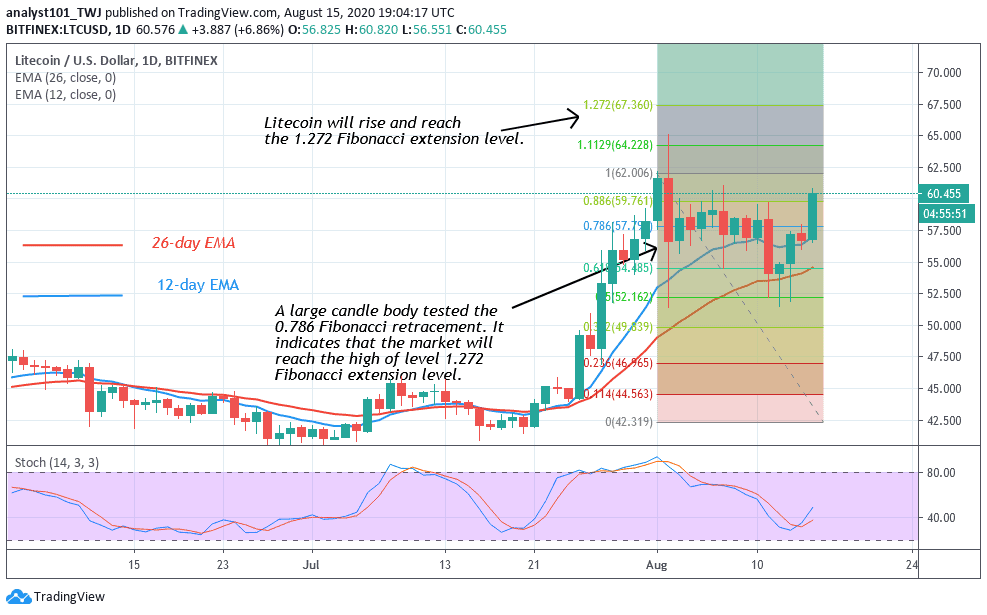
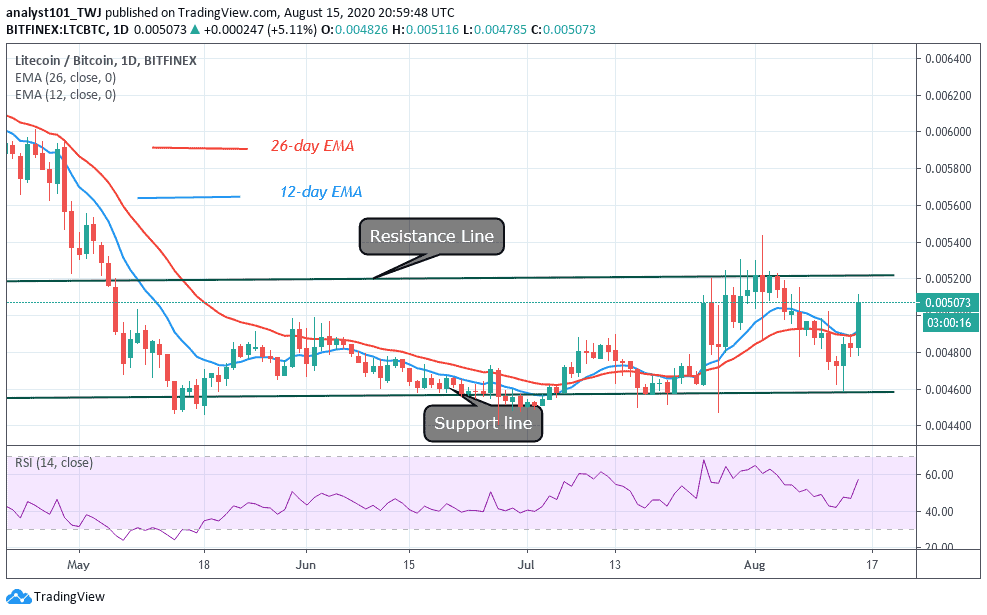
Today, bulls have broken above the $60 resistance after two weeks of range-bound movement. Buyers have to sustain the upward move by defending the current support. Similarly, LTC/BTC is in a sideways move as it fluctuates between levels Ƀ0.004600 and Ƀ0.005200.
LTC/USD Market
Key Levels:
Resistance Levels: $80, $100, $120
Support Levels: $50, $40, $20

Buyers have had the upper hand as they break the $60 resistance. Before now, the bears have earlier pushed price to $54 low to sink the altcoin. Simultaneously, the price tussle was going on between bulls and bears. If the bulls break the current resistance, it is an indication that the uptrend has resumed. On August 1 uptrend, the bulls were resisted at the $62 high and a red candle body tested the 0.786 Fibonacci retracement level. It indicates that LTC will reach a high of 1.272 Fibonacci extension level or the $68 high.
Litecoin Indicator Analysis
The price of Litecoin is well above the 12-day EMA and 26-day EMA. This indicates that the coin is likely to rise. LTC is above 40% range of the daily stochastic. It indicates that the market is in a bullish momentum.

On the LTC/BTC chart, the market is fluctuating between levels Ƀ0.004600 and Ƀ0.005200. On August 1, the bulls were resisted at the Ƀ0.005200 price level as the market fell to the support line. The price corrected upward to retest the resistance level. The market will continue the range-bound movement if the key levels remained unbroken. The pair is currently at level 57 of the Relative Strength index priod 14. This indicates that the pair is in the uptrend zone and it is above the centerline 50.
Join Our Telegram channel to stay up to date on breaking news coverage

