

Join Our Telegram channel to stay up to date on breaking news coverage
XRP Price Analysis – August 15
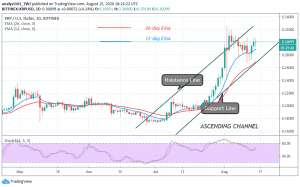
XRP/USD is attempting to break above the $0.30 resistance. This is a positive move as it will accelerate price movement on the upside. Similarly, XRP/BTC is also in an upward move but the coin is facing an initial resistance at Ƀ0.000026000.
XRP/USD Market
Key Levels:
Resistance Levels: $0.24, $0.26, $0.28
Support Levels: $0.22, $0.20, $0.18
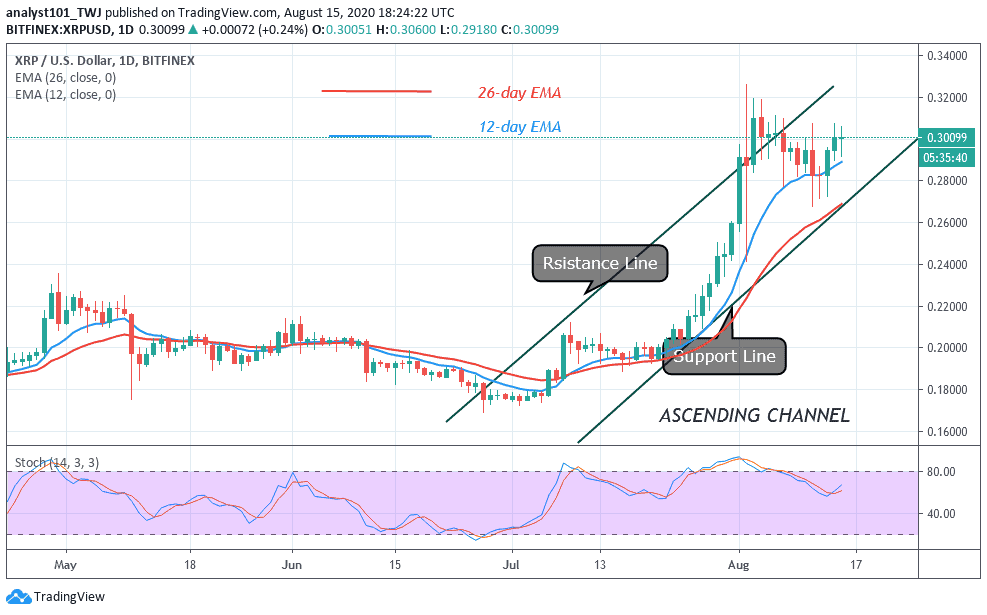
Today, Ripple is trading above $0.30 price level. For the past two weeks, XRP has been on a downward move. The coin was repelled at the $0.325 high and after a retest at $0.32, the selling pressure continued to $0.28 low. The upward move becomes possible because the current support level holds. Besides, the price is above the 12-day and 26 EMAs. This indicates that Ripple is likely to make an upward move. On the upside, if price is sustained above the $0.30 resistance, Ripple will continue to make an accelerated price movement. The current momentum will also break the $0.325 resistance if the bulls are successful. The market will reach $0.36 high once the resistance is breached.
Ripple intends to be the Amazon of the cryptocurrency world
Ripple was focusing solely on cross-border payments for the past five years when Brad Garlinhouse joined the company as the chief executive officer. Today, Ripple wants to be in the world of payment, what Amazon is to vendors, according to Financial Times news. Ethan Bear, the head of Ripple’s developer once said that they want to move from ‘’ writing cheques to writing codes”. What the company meant is that they want to promote the creation of new applications on the Ripple network.
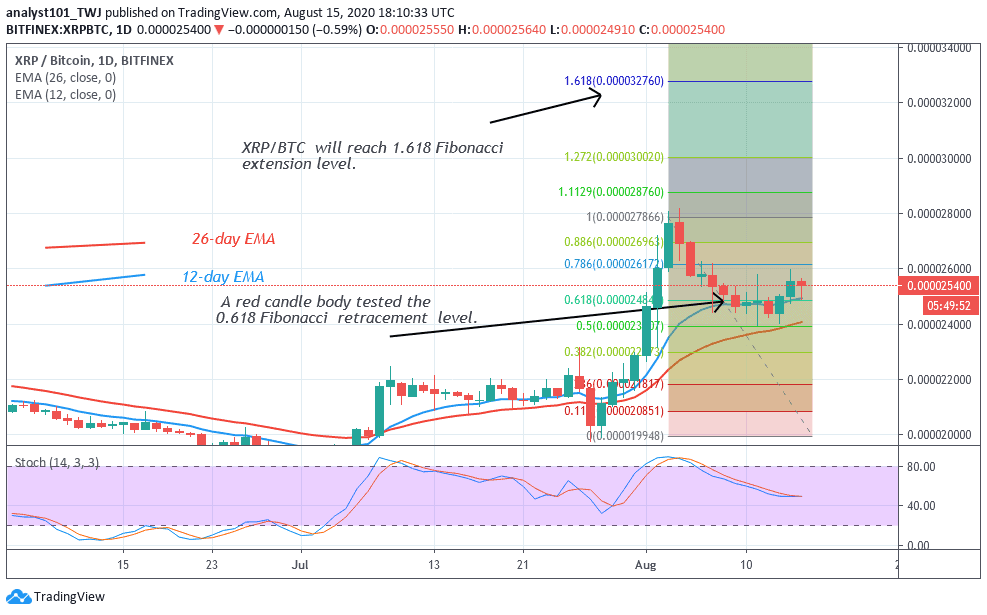
On the XRP/BTC chart, the price was fluctuating between levels Ƀ0.000020000 and Ƀ0.000022000 before the breakout. The crypto rebounded above Ƀ0.000020000 support to reach a high of Ƀ0.000028000. Price is likely to continue upward . In the August 3 uptrend, a red candle body tested the 0.618 or 61.8 Fibonacci retracement level. It indicates that the market will reach a high of level 1.618 extension level or Ƀ0.000032000 high. The coin is trading above a 40% range of the daily stochastic. It indicates that the price is in a bullish momentum.
Join Our Telegram channel to stay up to date on breaking news coverage
