Join Our Telegram channel to stay up to date on breaking news coverage
LTC Price Prediction – October 15
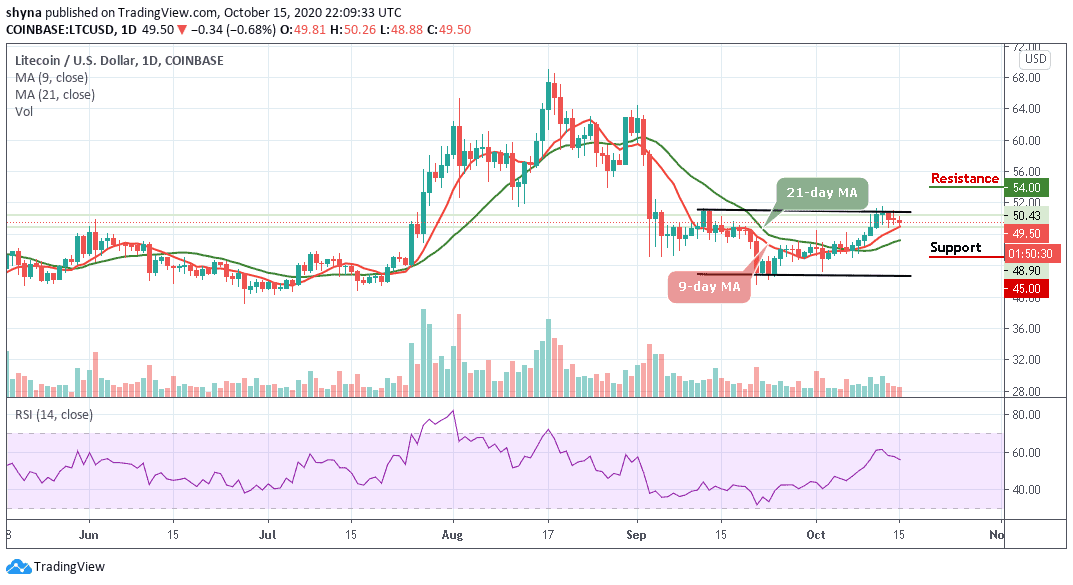
At market opening today, the LTC/USD price keeps following a bearish movement within the channel.
LTC/USD Market
Key Levels:
Resistance levels: $54, $56, $58
Support levels: $45, $43, $41

A few days ago, LTC/USD recorded some losses in 3 days consecutively but the improvement that the coin faced yesterday has been long-lived but the price was later back to around $49.84 where it closed. Today, the price touches the daily high of $50.26 and a low at $48.88, but currently, it seems the coin may be heading back towards the immediate support level of $48 below the 9-day moving average.
Where is LTC Price Going Next?
As the coin moves within the channel, in as much as the Litecoin price fails to rally from current trading levels, the greater the chance traders may see the cryptocurrency falling to another trading low. A break below the $48 support level may provoke an even deeper decline towards the $45, $43, and $41 levels. The short-term technical analysis shows that the $49 and $48 levels are currently the strongest forms of technical support.
Looking at the daily chart, a break above the upper boundary of the channel may propel LTC/USD to move towards the nearest resistance level of $52; a further push could take it to a high of $54, $56, and $58 resistance levels. Meanwhile, the RSI (14) is currently facing the south as the signal line moves below 55-level which may likely cause the market to experience more downward trends.
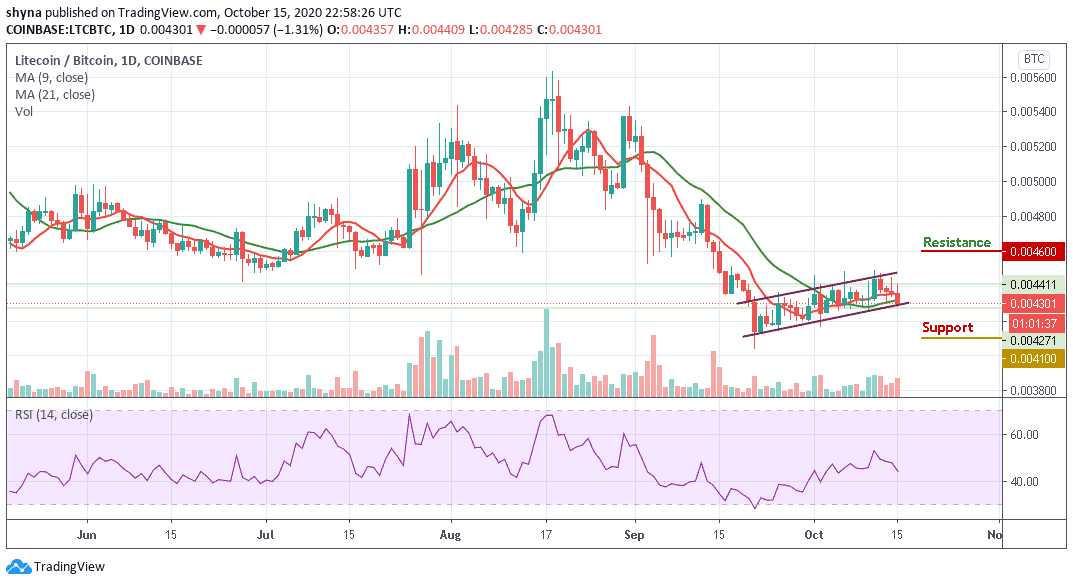
Comparing with BTC, the price of Litecoin is following a bearish movement around 9-day and 21-day moving averages. The tenth-largest crypto on the market cap is finding its ways below the moving averages because the market movement has remained clouded by more red candles.

However, as the RSI (14) nosedives to 45-level, a bearish step back may likely roll the market back to the support of 4500 SAT with a possible break below the 21-day moving average and further declines could be at 4100 SAT and below, which may establish a new weekly low for the market. Meanwhile, any bullish movement above the upper boundary of the channel may hit the resistance levels of 4600 SAT and above.
Join Our Telegram channel to stay up to date on breaking news coverage

