


Join Our Telegram channel to stay up to date on breaking news coverage
Bitcoin (BTC) Price Prediction – October 15
As reveals by the daily chart, the Bitcoin market has been struggling to maintain its momentum as its buy-side pressure wanes.
BTC/USD Long-term Trend: Bullish (Daily Chart)
Key levels:
Resistance Levels: $12,100, $12,300, $12,500
Support Levels: $11,000, $10,800, $10,600
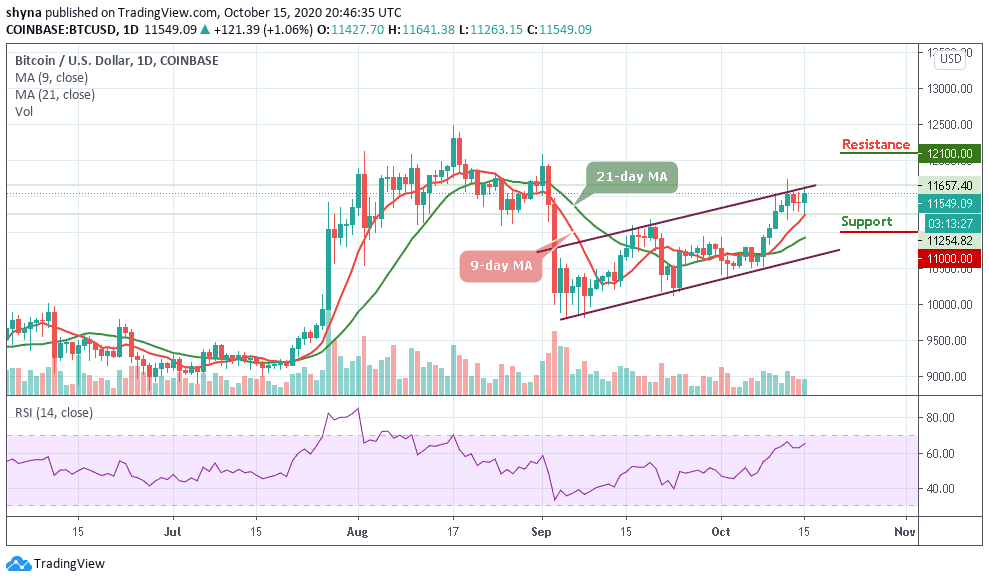
BTC/USD bulls may slowly come back into action after a minor battering from the bears in the last two days. If this happens, then the expectation of more recoveries could turn out to be true. Today, BTC/USD is seen trading at $11,549 after soaring to $11,641. The coin then pulled back to where it is trading currently and may continue to head downwards if the bears step back into the market.
Where is BTC Price Going Next?
The market is deciding around $11,549 above the 9-day and 21-day moving averages, where the buyers and sellers are anticipating for a clear breakout or breakdown. Meanwhile, the $11,700 and $11,900 levels may further surface as the key resistances should the $7,600 level holds. However, a strong bullish spike may take the price to $12,100, $12,300, and $12,500 levels.
Moreover, if the market makes a quick turn to the south, the BTC/USD price may likely drop to $11,200, and should this support fails to contain the sell-off, traders may see a further roll back to $11,000, $10,800, and critically $10,600. Meanwhile, the RSI (14) is suggesting an upward movement for the coin.
BTC/USD Medium – Term Trend: Ranging (4H Chart)
The 4-hour chart for BTC is still looking bullish, but the market has been showing a sign of weakness since the daily opening. However, the intraday trading is looking bullish; following the recent rebound at $11,263 which is now a key support level. The next key support levels are $11,300, $11,100, and $10,900.
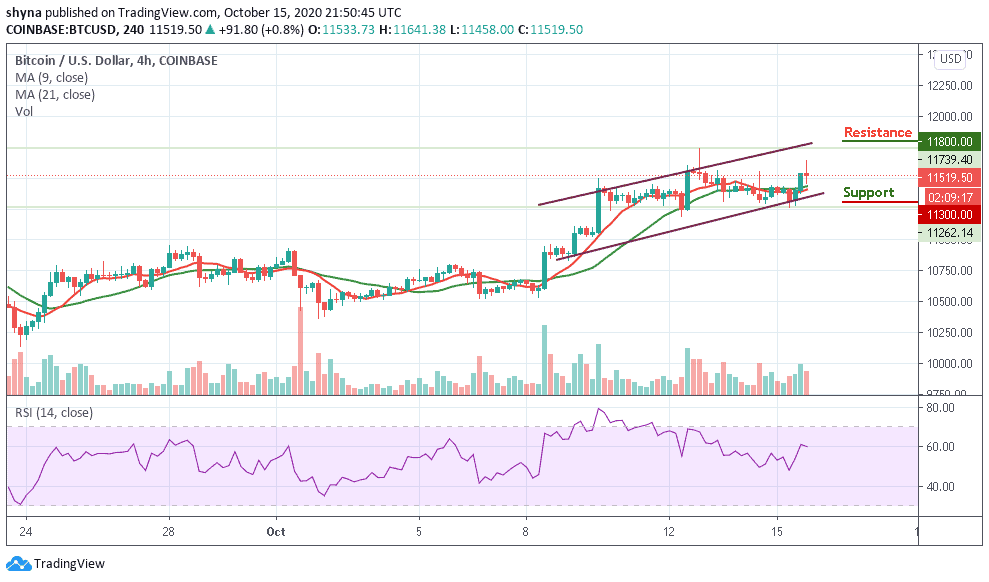
However, considering the recent sharp rebound, the Bitcoin price may re-enter the bullish rally to $11,600 resistance. A climb above the mentioned resistance may further push BTC price to $11,800, $12,000, and $12,200 resistance levels. As it appeared now, it seems the bears may likely return into the market as the RSI (14) may cross below the 60-level and could resume a downward direction.
Join Our Telegram channel to stay up to date on breaking news coverage
