Join Our Telegram channel to stay up to date on breaking news coverage
Bitcoin (BTC) Price Prediction – October 15, 2020
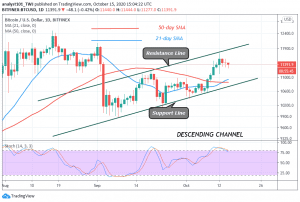
BTC/USD is in a range bound move between $11,200 and $11,450. This price range has been broken twice during a price surge. Unfortunately, the selling pressure at the recent highs has pushed BTC back to the range-bound zone. Today, BTC is trading at $11,405.60 at the time of writing.
Resistance Levels: $10,000, $11, 000, $12,000
Support Levels: $7,000, $6,000, $5,000

Bitcoin (BTC) has been confined in a price range Since October 10. On October 12, the bulls broke the range-bound zone as price reached a high of $11,700. However, selling pressure at the recent high pushed BTC to the range-bound zone. Yesterday, the king coin reached the $11,564 high. The bears were on hand as the coin fell to the range-bound zone.
The recent price action explains that the coin lacks buying power at a higher price level. In other words, the higher price levels are attracted by selling pressure by short term traders. The bottom line is that the coin is always falling above the critical support zones of $11,100, $11,200, and $11,300. The upward movement will continue as long as price is above these levels. Besides, the bullish momentum will return if buyers push BTC above the $11,500 high. The coin will pick up momentum and resume an uptrend.
Bitcoin (BTC) Indicator Analysis
The crypto is currently below the 80% range of the daily stochastic. The coin is out of the overbought region as sellers emerge to push prices downward. It is in a bearish trend zone. The price retracement has reached bearish exhaustion above the $11,300 high. However, if price retraces and breaks below the SMAs, the downtrend will resume. This is unlikely.
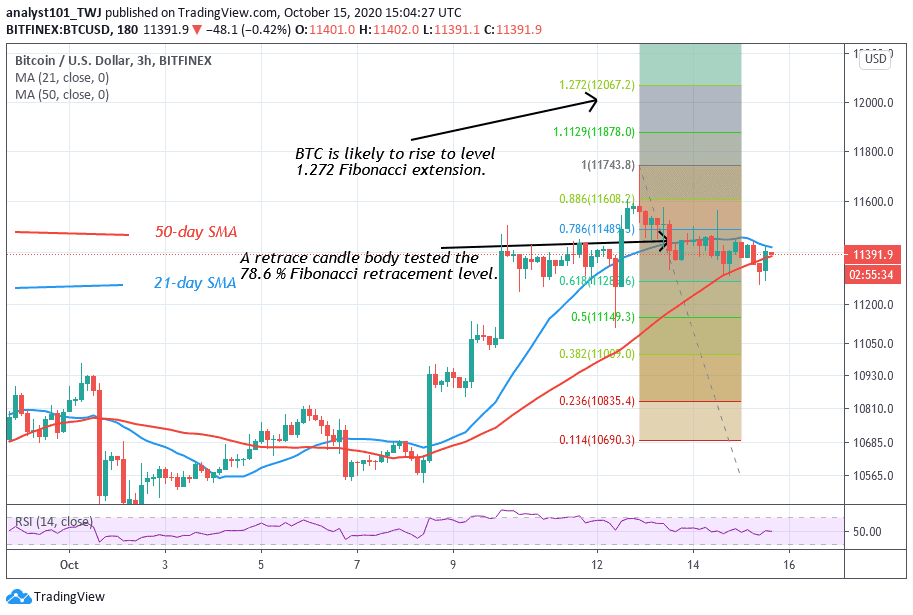
Bitcoin price is still hovering above the critical support zones. According to the Fibonacci tool analysis, Bitcoin is likely to make a further upward move to the previous highs. On October 12 uptrend, BTC reached the high of $11,609 but the coin was repelled. The retraced candle body tested the 78.6% Fibonacci retracement level. This gives the impression that the coin will reach level 1.272 Fibonacci extension. In other words, the coin will reach level $12,067.20 but will face another rejection. The price will have an initial retracement then followed by a fresh uptrend.
Join Our Telegram channel to stay up to date on breaking news coverage