Join Our Telegram channel to stay up to date on breaking news coverage
LTC Price Prediction – July 2
LTC/USD may likely set a bullish run if the market can climb back above the $42.
LTC/USD Market
Key Levels:
Resistance levels: $45, $46, $47
Support levels: $38, $37, $36
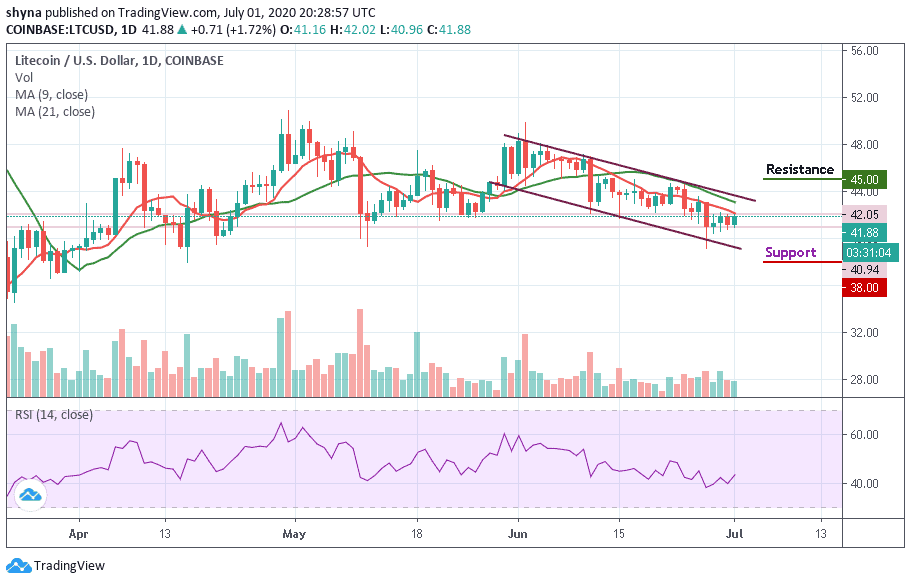
Presently, LTC/USD is seen showing a positive movement over the past few hours. The market is actually running a little retracement move towards $44 with the price growth of 1.72%. Despite today’s gain, Litecoin (LTC) is still maintaining a downtrend movement within the descending channel. We can expect the price to continue to rise as soon as the bulls put more pressure on the market.
Moreover, if the lower boundary breaks this time, the price may slide back to $40 and $41 support. If the price can keep respecting the upward movement, we can then expect a bullish continuation after testing the $40 support. As the technical indicator, RSI (14) moves to cross above the 40-level, the next level of resistance to keep an eye on is the $45, $46, and $47 in the long-term.
However, if the coin can continue to maintain the bullish movement for the next couple of days, we may witness a more bullish trend. But the price formation is showing that a bearish breakout may likely play out for this market. Meanwhile, LTC/USD still remains bearish in the short-term. Inversely, a bearish extension could roll the coin back to the long-term support at $38, $37, and $36 levels.
When compares with Bitcoin, LTC continues to trend bearishly as the support further outweighs the resistance. In case of a trend reversal, there is a need for an increasing volume and resistance to cause an upsurge in the market. Now, the token is trading around the 4511 SAT below the moving averages. We can expect close support at the 4300 SAT and beyond.
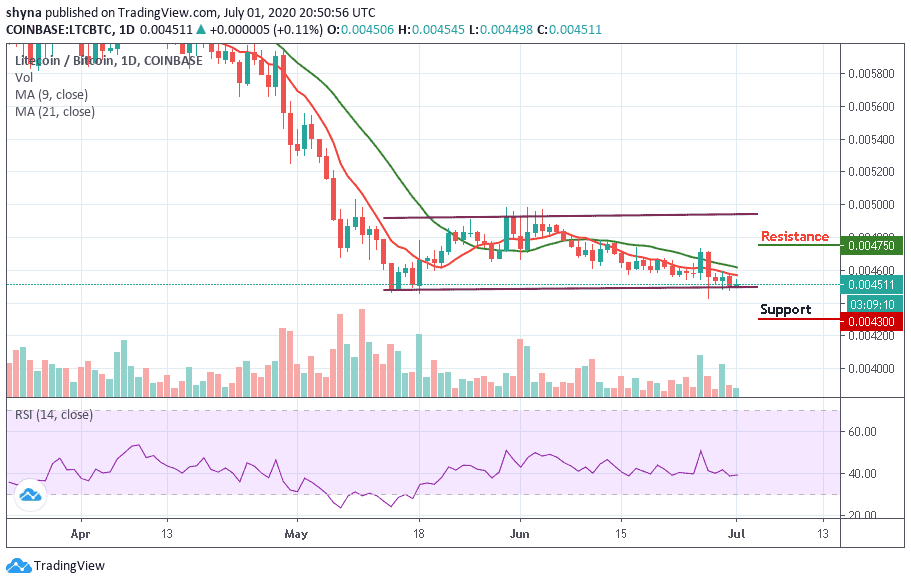
For now, there’s no sign of a bullish movement in the LTC market. However, if a bullish move occurs and validates a break significantly above the 9-day and 21-day moving averages to hit the nearest resistance at 4600 SAT; we can then confirm a bull-run for the LTC/BTC pair. More so, the closest resistance lies at 4750 SAT and 4850 SAT as the RSI (14) moves around 40-level.
Join Our Telegram channel to stay up to date on breaking news coverage