Join Our Telegram channel to stay up to date on breaking news coverage
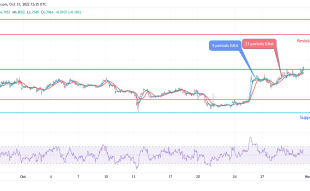
LTC Faces a Resistance – October 31
After a long-striving effort on the part of the LTC/USD market to surge upward in a rallying motion, the crypto currently faces resistance at a near distance above the $55 line. Price is trading around $54.60 at an average percentage rate of 1.35 negative.
LTC Faces a Resistance: LTC Trade
Key Levels:
Resistance levels: $60, $65, $70
Support levels:$50, $45, $40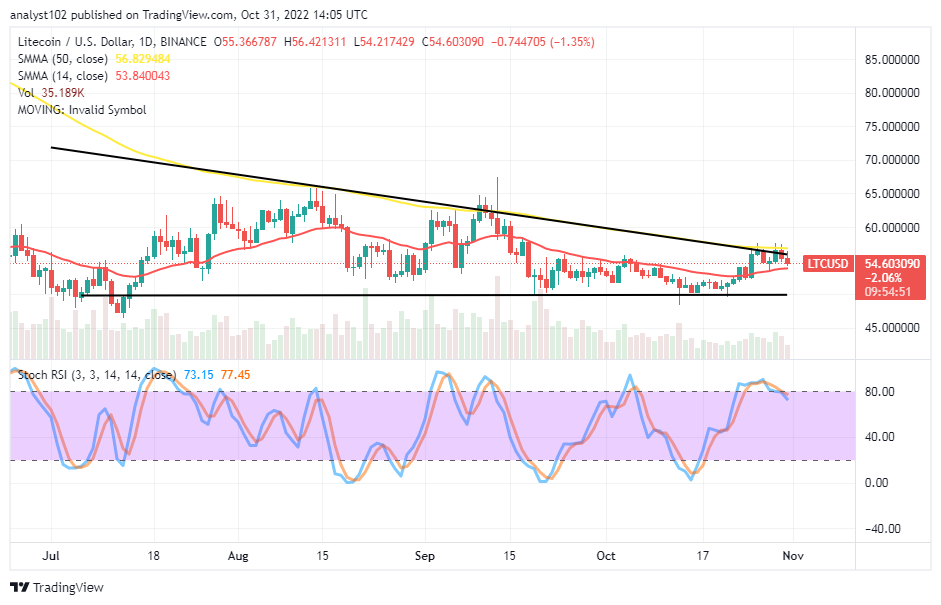 LTC/USD – Daily Chart
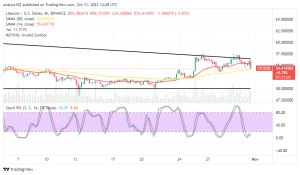
The daily chart showcases the LTC/USD market faces resistance around the trend line of the bigger SMA. The 14-day SMA indicator is at $53.84, underneath the $56.83 value line of the 50-day SMA indicator. The bearish trend line drew alongside the bigger SMA to indicate the crypto economy is under a falling force. The Stochastic Oscillators have crossed southbound from a point above the 80 range line to place at 77.45 and 73.15 range values.
Will the LTC/USD market soon lose positions toward the downside?
The LTC/USD market has been proven worthy of declining as it faces resistance around the bearish trend line drawn alongside the bigger SMA. As it is, long-position placers exercise cautiousness toward opening new buying orders. In actual technical trading ethics, buyers must postpone their actions to allow for a different formation to form. They must then use the Stochastic Oscillators’ tools to determine the market’s likely lower trading spot in the ensuing sessions before returning to their original buying order.
Selling activity appears to have changed shape around the trend line and the price range, which is news for the technical analysis. Therefore, the LTC/USD market sellers need to take advantage of settling a sell order around the identified trading spot, especially when the market tends to spike falsely around the value line. At that presumption, the market may fall back to rebuild support around its previous low point of $50.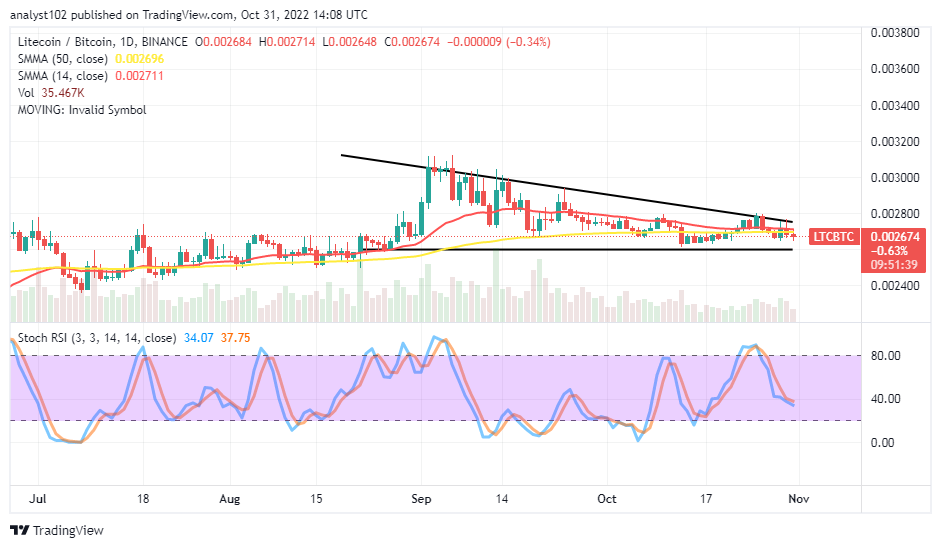
LTC/BTC Price Analysis
Litecoin is slightly debasing below the trend lines of the SMAs, pairing the trending ability of Bitcoin. The pairing cryptocurrency market faces a resistance of the bearish trend line. The 14-day SMA indicator has trended eastward closely over the 50-day SMA indicator. The Stochastic Oscillators have crossed southward 37.75 and 34.07 range values. That indicates the cryptocurrency pair market may still take time to launch a stance closely over the horizontal line drew below the SMA trend lines.
The Dash 2 Trade presale has raised more than $3 million since it started less than two weeks ago. This token auction is one of the fiercer ones this year.
Related
Join Our Telegram channel to stay up to date on breaking news coverage