
Join Our Telegram channel to stay up to date on breaking news coverage
Litecoin Pushes Lowly – October 23
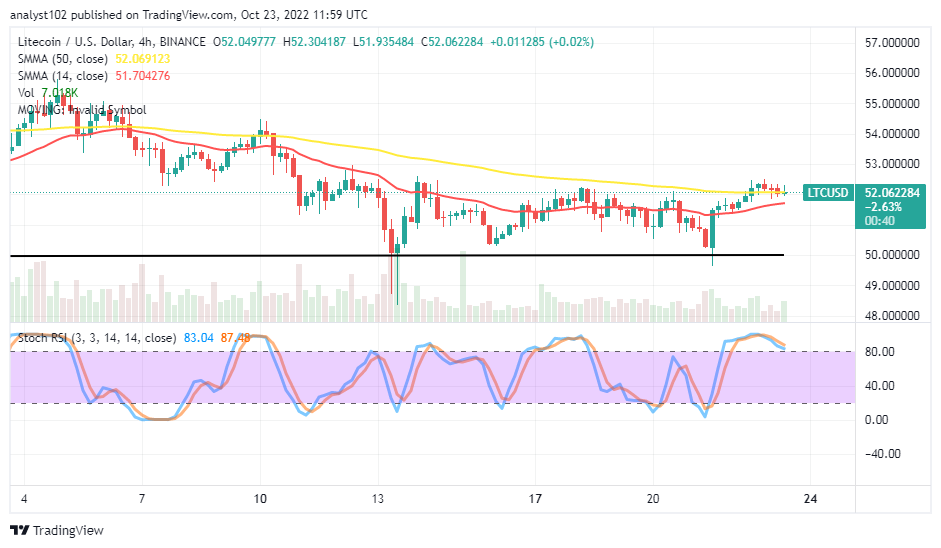
There have been concurrent in-active moving efforts in the LTC/USD market operations as the crypto trade pushes lowly against a resistance below the $55 line. The crypto economy has been trading around $52.05 at a minute negative percentage rate of 0.30.
LTC Suffers Slow Precipitations
Key Levels:
Resistance levels: $55, $65, $75
Support levels: $45, $40, $35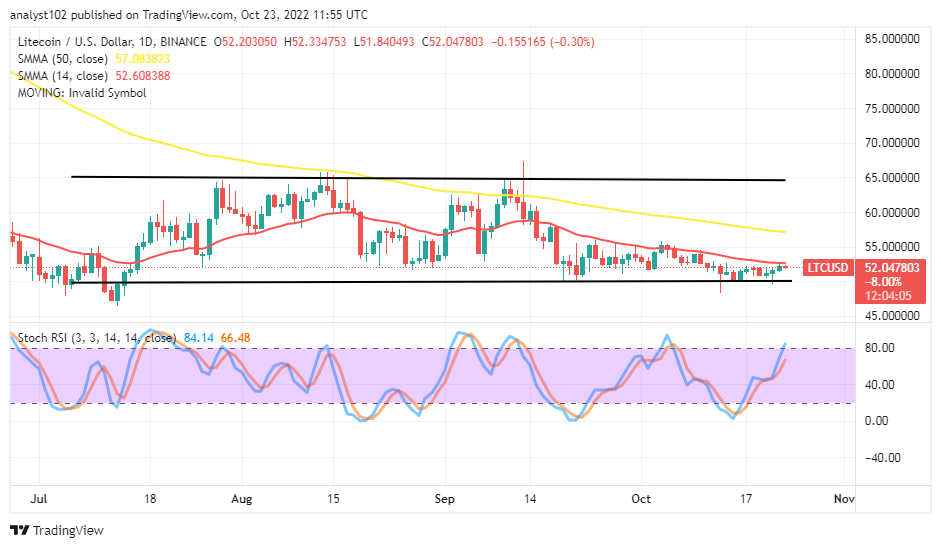 LTC/USD – Daily Chart
The daily chart reveals the LTC/USD market price pushes lowly to the upside, having found support around the $50 support level in the recent sessions. Variant candlesticks have formed in compliance with the south side around the smaller SMA. The 50-day SMA indicator is at $52.61, beneath the $57.10 value point of the 50-day SMA indicator. The Stochastic Oscillators are around 66.48 and 8414 range values, showing an upward motion is on.
Will the LTC/USD market sustain moves around the smaller SMA trend .line afterward?
The LTC/USD market sustains moves around the smaller SMA trend line as it pushes lowly to the upside. A line of candlesticks has spanned northward to touch a path it has been keeping to the downside around the smaller SMA trading indicator. That signifies the market may not have the strength to stay afloat away from its current trading spot in the subsequent sessions. Buyers are to stay off from executing an order at this point. And it may run into some days.
A falling force may resume around the 14-day SMA trend line. A spike coupling with an early retracement-moving mode will systemically give back to a decent timely-sensitive selling order entry. Sellers should stay alert while active motion comes to force before making a comeback. The US currency may be less-active by letting the crypto economy spring more toward the point of the 50-day SMA indicator to encounter a higher-trading resistance if they fail to hold a firmer stance around the $55.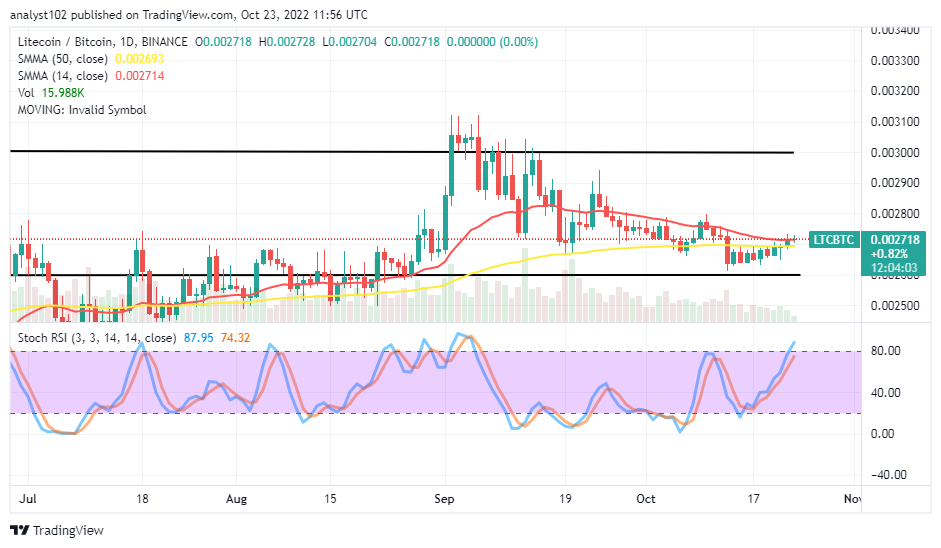
LTC/BTC Price Analysis
In comparison, the trending weight of Litecoin against Bitcoin has gone down to locate support beneath the trend lines of the SMAs. The 14-day SMA indicator is near above the 50-day SMA indicator. The lower horizontal line drew to mark up the point the base crypto may be making swings while the counter crypto attempts to press hard for the completion of a decreasing motion. The Stochastic Oscillators have managed to penetrate the overbought region at average range points of 74.32 and 87.95. That gives an insight LTC may not sustain subsequent ups against its counter-trading crypto.
Dash2Trade presale stage one has sold completely – which took under four days. D2T is now still affordable in stage two at 0.05 USDT. Almost $2 million has been raised thus far in total.
Related
Join Our Telegram channel to stay up to date on breaking news coverage