Join Our Telegram channel to stay up to date on breaking news coverage
LTC Price Prediction – December 9
If Litecoin (LTC) failed to stage a meaningful short-term rally, the cryptocurrency may likely see a worrying decline towards the $42 support level.
LTC/USD Market
Key Levels:
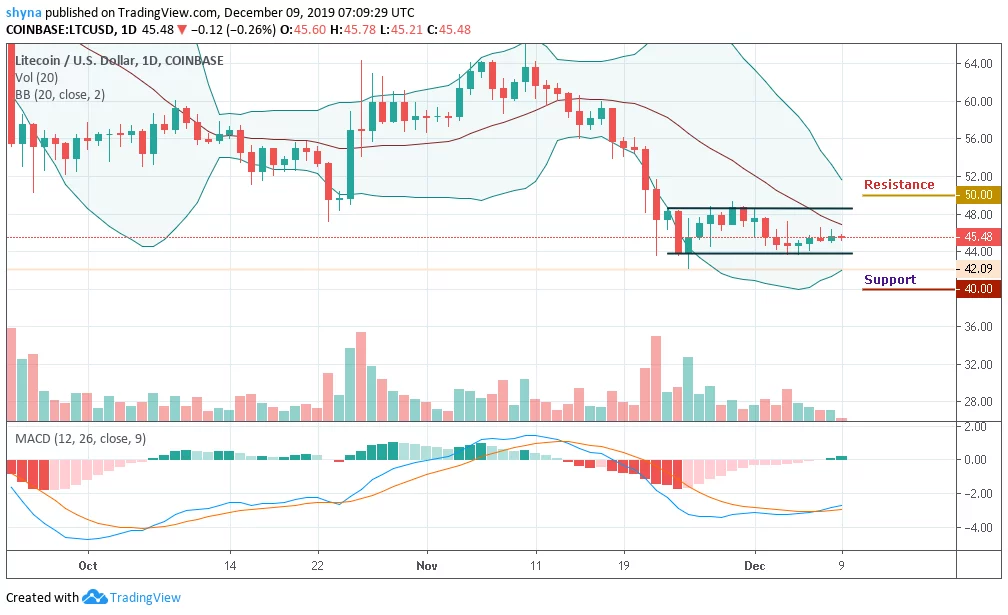
Resistance levels: $50, $52, $54
Support levels: $40, $38, $36
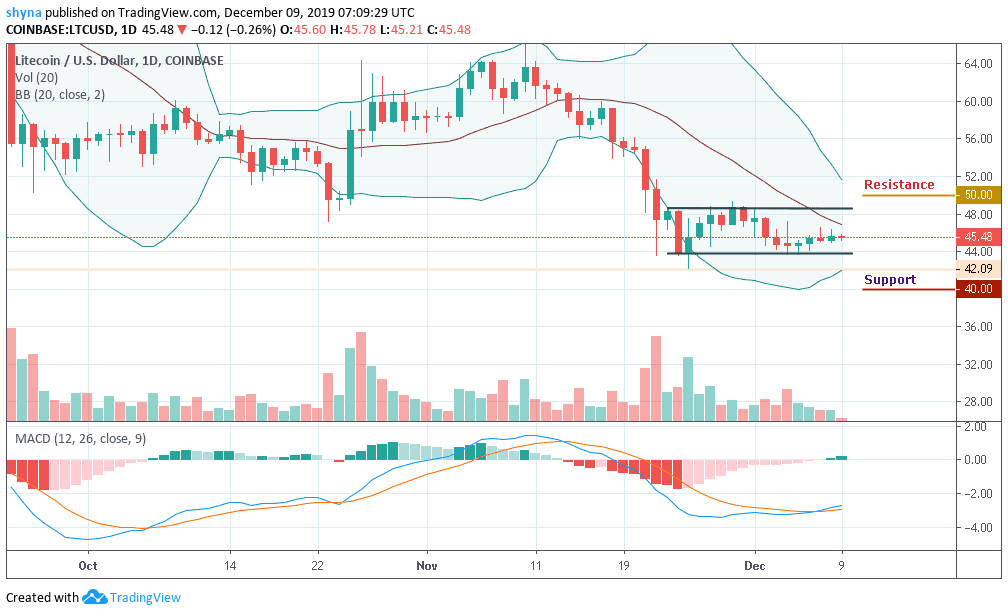
LTC/USD price is indicating an indecisive in the market movement within the middle boundary of the Bollinger bands. The coin is bitten by the bear and once again the expectations of upsurge are ruined. We were quite apprehensive about the progression of LTC/USD, but it looks like the coin would take time to improve.
Meanwhile, in as much as the coin fails to rally from current trading levels, the greater the chance that we may see the cryptocurrency falling to a new multi-month trading low. A break below the $43 support level may provoke an even deeper decline towards the $40, $38 and $36 levels. The short-term technical analysis shows that the $43 and $42 levels are currently the strongest forms of technical support before the $41 level starts to come back into focus.
However, as the LTC price remains jerky, we await the possible direction of the coin. For a positive peak, the $50, $52 and $54 are the main resistance levels for the token at the moment. Looking at the volume of the chart, we can see the LTC at its lowest. More so, LTC/USD is bearish in the long run as the MACD signal lines are within the negative side which shows the signs of weakness in the market.
When compared with Bitcoin, LTC/BTC is attempting to rise towards the support turned resistance at 6125 SAT. Unless this resistance is effectively breached and the price ends up closing above it, there is not much reason to expect any long term bullish reversal.

However, a possible bearish continuation is likely to meet major support at 5800 SAT before falling to a new low of 5700 SAT and below while the buyers may continue to push the market to the critical potential resistances of 6400 SAT and above. The RSI (14) moves to touch level 40 but may likely witness a bullish trend.
Please note: Insidebitcoins.com is not a financial advisor. Do your research before investing your funds in any financial asset or presented product or event. We are not responsible for your investing results.
Join Our Telegram channel to stay up to date on breaking news coverage