Join Our Telegram channel to stay up to date on breaking news coverage
LTC Price Prediction – February 13
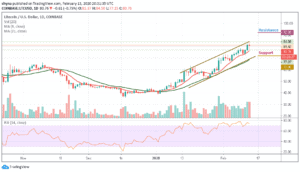
Litecoin (LTC) collapses from the intraday high to trade near the 9-day moving average as the downside momentum may be extended towards $75.
LTC/USD Market
Key Levels:
Resistance levels: $92, $94, $96
Support levels: $72, $70, $68
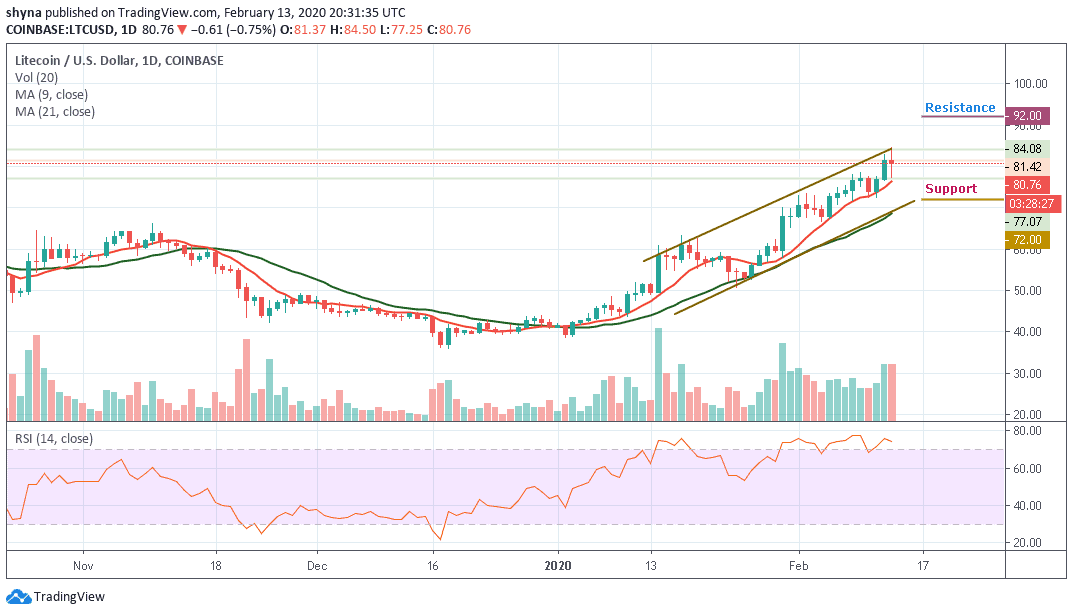
LTC/USD fell victim to massive volatility in the cryptocurrency market. The sixth-largest coin with the current market value of $5.1 billion hit a new high of 2020 at $84.08 and dropped like a stone to $77.07 in a matter of hours. At the time of writing, LTC/USD is changing hands at $80.76, down nearly 0.75% after a rebound from $77.07 level. Currently, the daily chart reveals that the technical indicator is making an attempt to move out of the overbought condition, which means the coin may be vulnerable to further losses.
Meanwhile, in as much as the coin fails to rally from current trading levels, the greater the chance that we may see the cryptocurrency falling to a new trading low. A break below the 9-day moving average at $73 support level may provoke an even deeper decline towards the $72, $70 and $68 levels. The short-term technical analysis shows that the $76 and $75 levels are currently the strongest forms of technical support before the $74 level starts to come back into focus.
However, as the technical indicator RSI (14) remains in the overbought zone, we await the possible direction of the coin. Therefore, for a positive peak; the $92, $94 and $96 are the main resistance levels for the token at the moment. Moreover, looking at the volume of the chart, we can see the Litecoin (LTC) at its highest which also indicates that LTC/USD is bullish in the long run.
Looking at the daily chart, comparing LTC with BTC, we can easily see that the pair has eventually broken solid support at 7600 SAT before a rebound back to where it is trading currently at 7873 SAT. More so, any attempt by the technical indicator to cross below the 70-level, Litecoin price could see another sharp drop at the 7300 SAT support level. Breaking this level could further take the price to the critical support levels at 7200 SAT and 6800 SAT below the 9-day and 21-day moving averages.
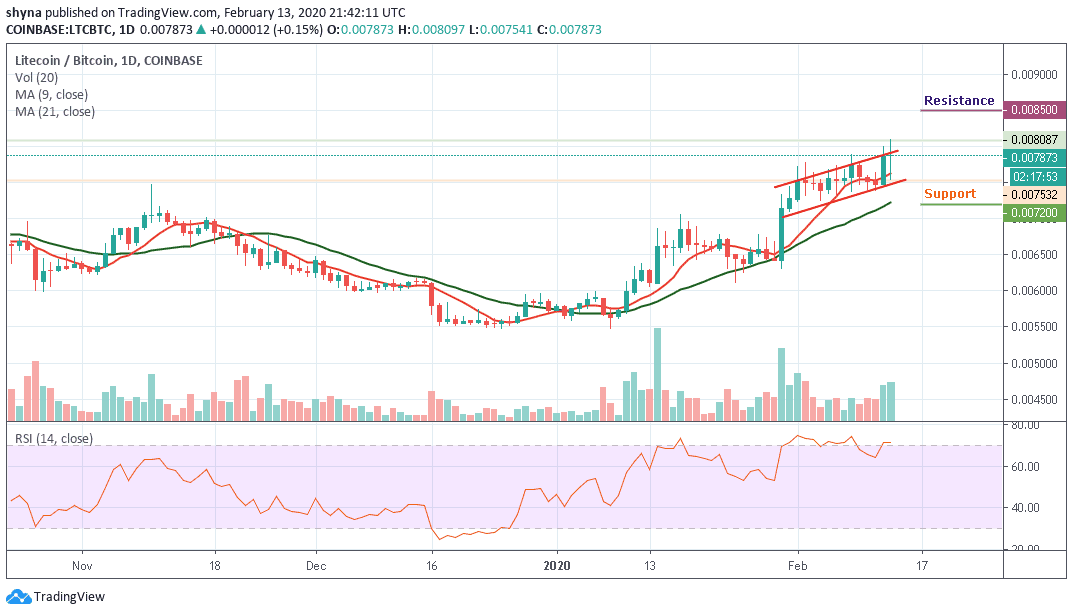
However, as the Litecoin price is trading at the 7873 SAT level, if the bulls can hold the price as it is and move it towards the north, the coin may likely break out of the ascending channel to retest the resistance level of 8087 SAT, the next key resistance levels lie at 8200 SAT and 8400 SAT respectively. Reaching these levels might take it to the potential resistance levels of 8500 SAT and 8700 SAT.
Please note: Insidebitcoins.com is not a financial advisor. Do your research before investing your funds in any financial asset or presented product or event. We are not responsible for your investing results.
Join Our Telegram channel to stay up to date on breaking news coverage