Join Our Telegram channel to stay up to date on breaking news coverage
LTC Price Prediction – November 28
It is likely for the Litecoin (LTC) to settle in a range between $46 and $50 as the technical indicator RSI (14) moves in the same direction.
LTC/USD Market
Key Levels:
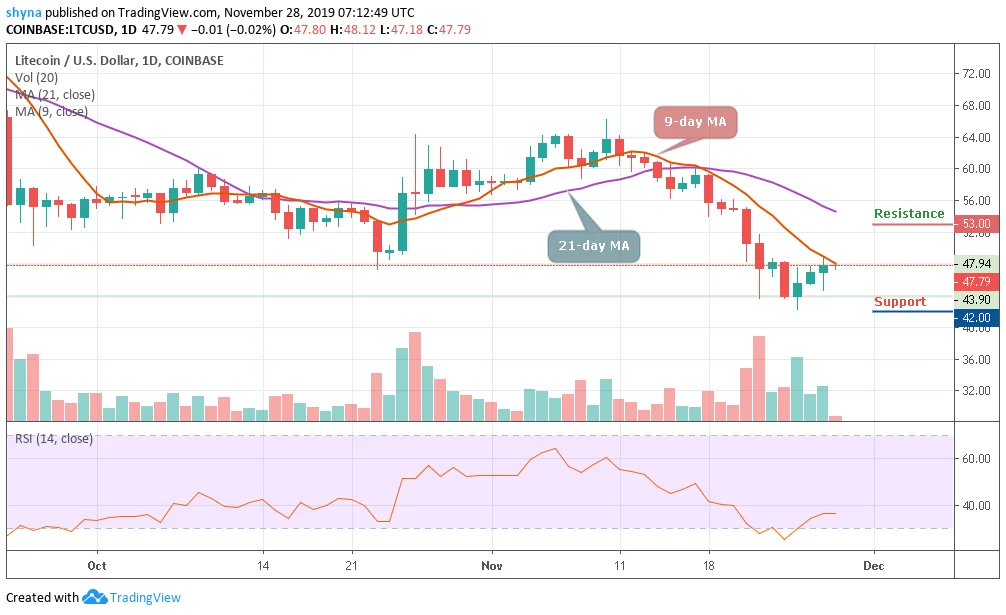
Resistance levels: $53, $55, $57
Support levels: $42, $40, $38
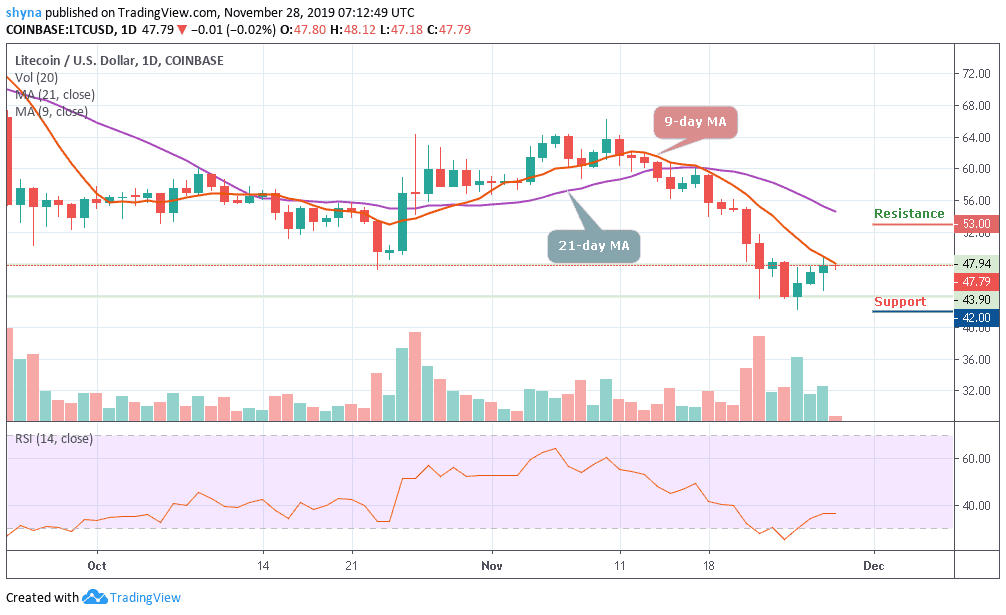
In the last few days, LTC/USD has managed to regain some ground amid technical correction from oversold territory to where it is currently. More so, after the coin recovered from the sharp sell-off, the range of the price swings has been between $43.90 and $47.94. Litecoin bulls took advantage of the low price to get more positions. For now, the momentum has not been strong enough to convince the bulls that the reversal is significant.
Looking at the chart, the Litecoin has lost its value since June highs of about $146. Halving in August did little to stimulate growth. Instead, the coin continued to reduce its value below several key support levels, including $80, $60, and the recent break below $50. After the breakdown, the $42 level emerged as a critical support level.
Meanwhile, the perspective strong resistance is now created near the 9-day moving average at $48.19 level. It could go beyond this and take the price towards the potential resistance level of $53 around the 21-day moving average. The next resistance comes at $55 and $57 levels. On the other hand, a sustained move below the $43.90 intraday level will pave the way for $42 support.
However, the next support levels to watch for could be $40 and $38 respectively but the RSI (14) indicator moves in the same direction below the 40-level.
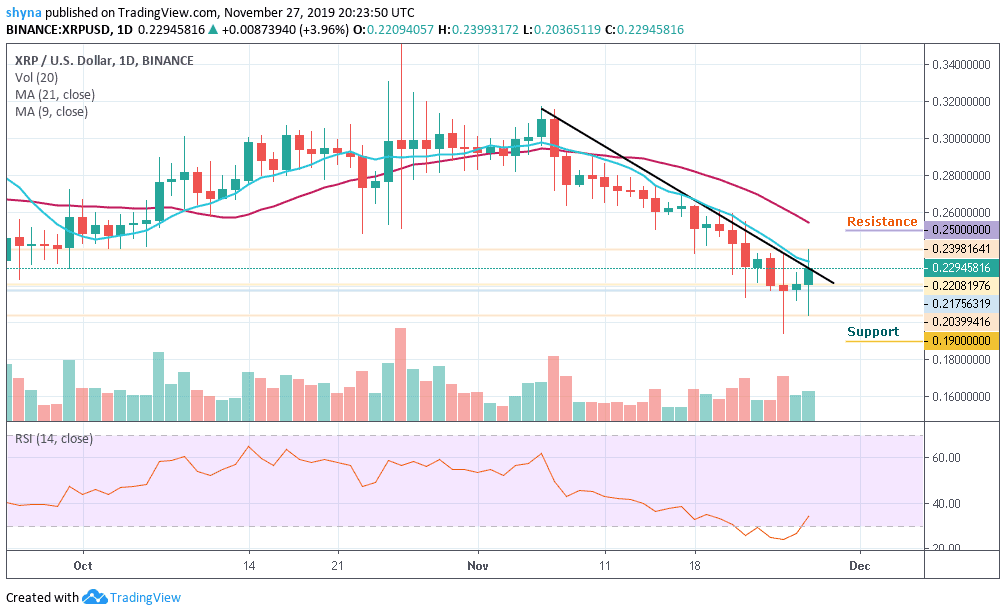
When compared with Bitcoin, the Litecoin price is making effort to push the price towards the 9-day moving average in other to reach the support turned resistance at 6553 SAT. Unless this resistance is effectively breached and the price ends up closing above it, there might not be any reason to expect the long-term bullish reversal.
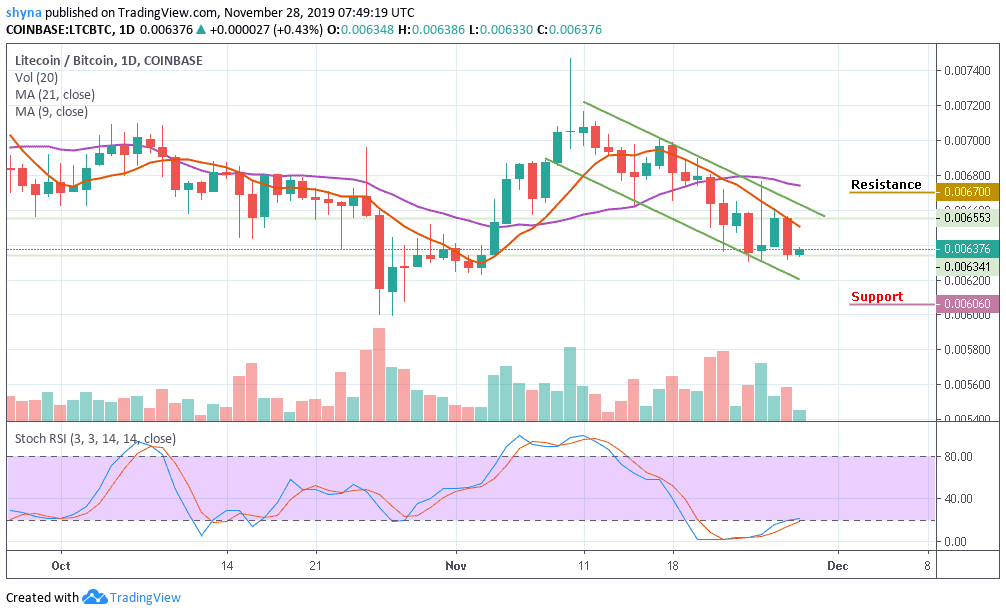
However, trading under the 6341 SAT support level and crossing below the lower boundary of the channel may likely bring a possible bearish continuation that will meet the major support at 6150 SAT before falling to 6060 SAT and below while the buyers may push the market to the potential resistance level of 6700 SAT and above. Meanwhile, the stochastic RSI may soon be coming out of the oversold zone to give support to the bulls.
Please note: Insidebitcoins.com is not a financial advisor. Do your research before investing your funds in any financial asset or presented product or event. We are not responsible for your investing results.
Join Our Telegram channel to stay up to date on breaking news coverage