Join Our Telegram channel to stay up to date on breaking news coverage
LTC Price Prediction – December 30
As LTC/USD recovered above the 21-day moving average, a sustainable movement above the $45 resistance level is needed to stimulate recovery.
LTC/USD Market
Key Levels:
Resistance levels: $48, $50, $52
Support levels: $36, $34, $32
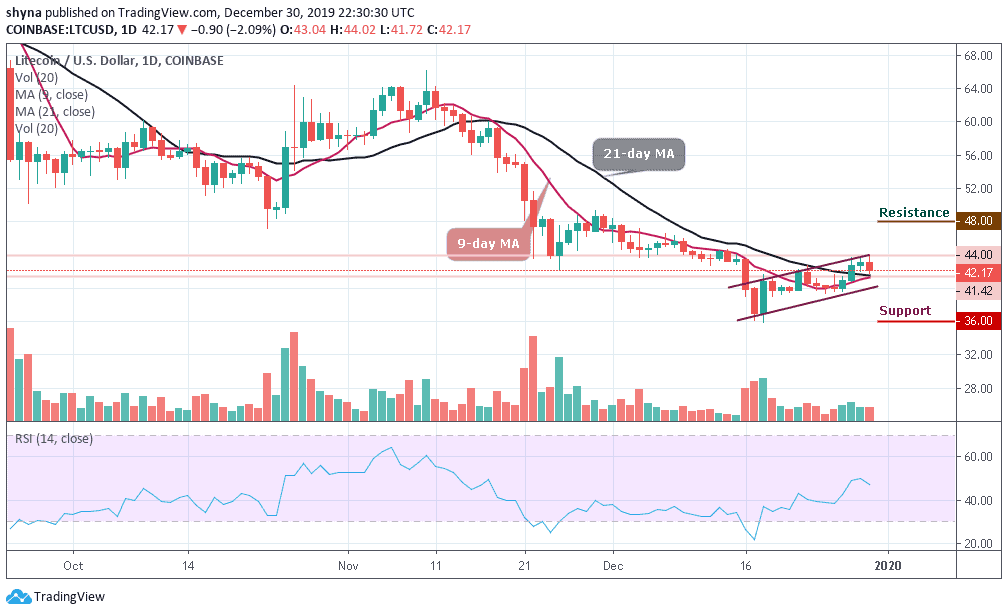
LTC/USD is currently trading at the support provided by the 9-day and 21-day moving averages. However, a break above the trend line could suggest that the market is headed higher. Still, Litecoin has seen a slight decrease of 2.09% after a bullish movement earlier today, putting the coin’s market cap to $2.72 billion and in sixth place amongst the top cryptocurrencies.
However, as the market opens today, Litecoin price started trading at $43.22 and it recovered towards $44.0 before dropping to $42.17 where it is currently. A bullish regroup may bring a decisive move with a potential break above the ascending trend line. If such a scenario occurs, the price is likely to go as high as $48, $50, and $52. On the long-term outlook, LTC/USD remains on its downtrend as a rebound is possible if the $41 can act strong.
While the price at $41 level, the LTC/USD is likely to go down to the $36, $34 and $32 supports if the bears turn up. To follow the RSI (14) signal line which makes a quick turn below the 49-level following the recent drop in the market and leading to a price break down on the daily chart, a possible down surge may likely push the market to the south.
Against Bitcoin, Litecoin (LTC) made an attempt to cross the upper boundary of the descending channel to touch the resistance at 5973 SAT before dropping back to 5836 SAT. Unless this resistance is effectively exceeded for the price to close above it, there might not be any reason to expect the long-term bullish movement.
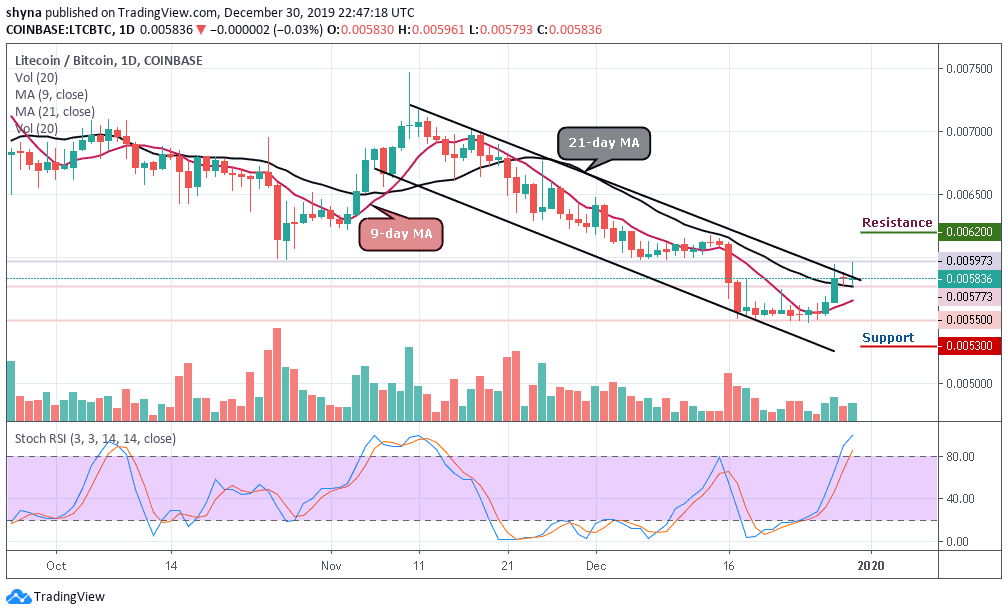
However, if the coin trade below the 9-day and 21-day moving averages, it could refresh lows under 5600 SAT and a possible bearish continuation may likely meet the major support at 5300 SAT before falling to 5100 SAT and below while the buyers may need to push the market to the critical potential resistances at 6200 SAT and above as the stochastic RSI indicator moves within the overbought zone.
Please note: Insidebitcoins.com is not a financial advisor. Do your research before investing your funds in any financial asset or presented product or event. We are not responsible for your investing results.
Join Our Telegram channel to stay up to date on breaking news coverage