Join Our Telegram channel to stay up to date on breaking news coverage
LTC Price Prediction – November 12
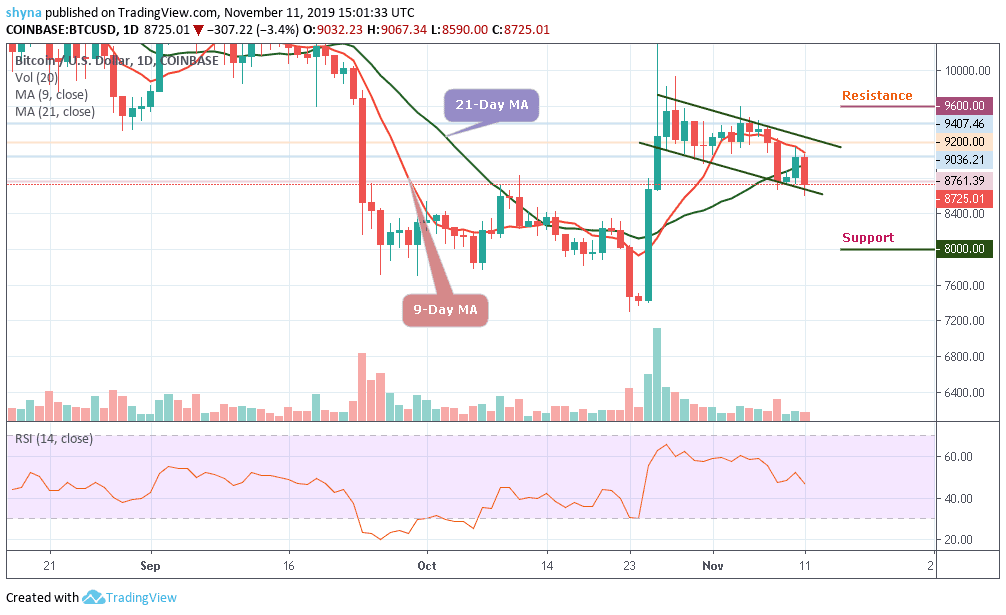
Litecoin (LTC) manages to maintain its position despite volatility, while the bulls still maintain the desire to defend the support at $60.
LTC/USD Market
Key Levels:
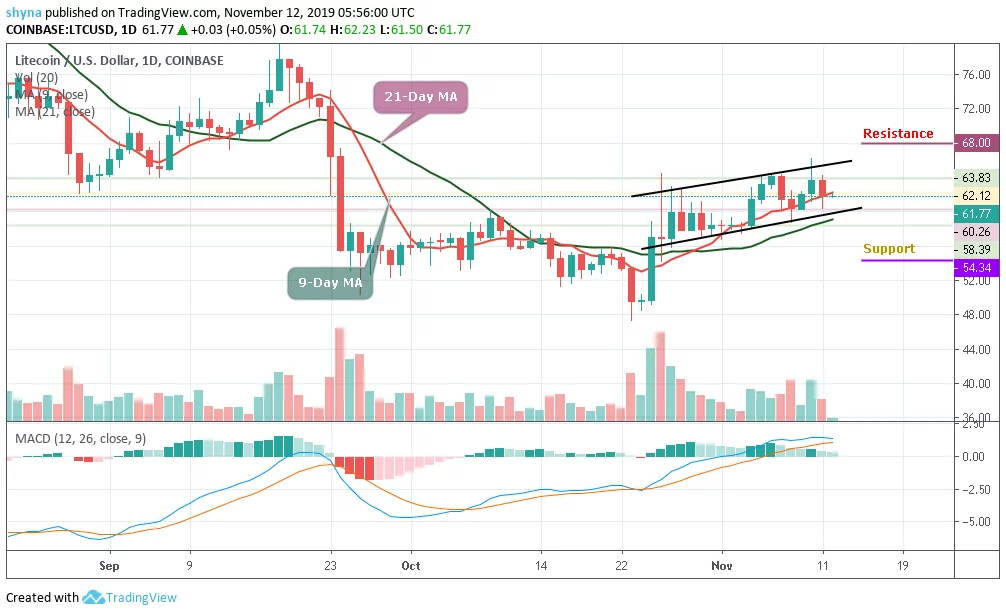
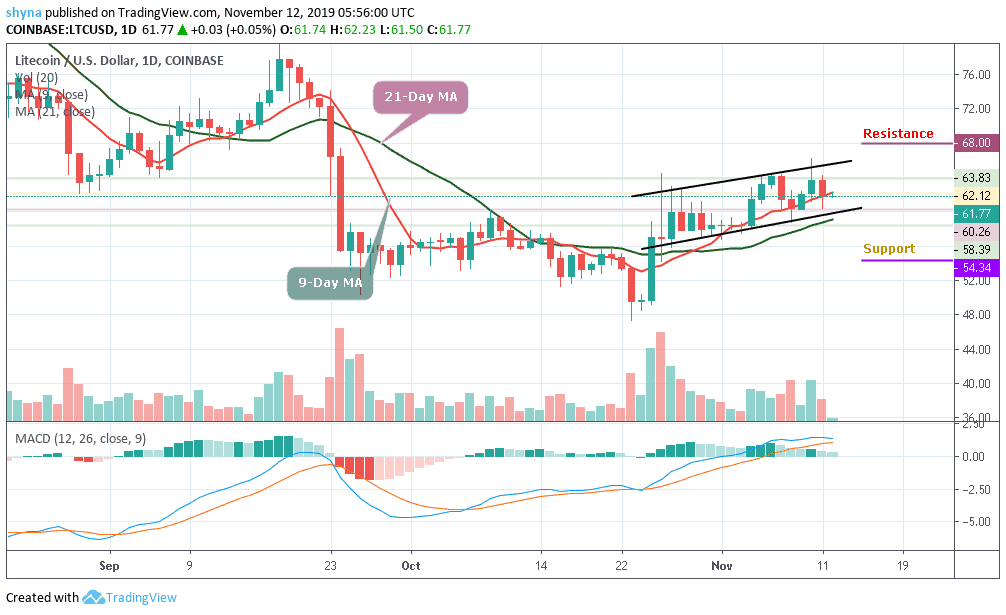
Resistance levels: $68, $70, $72
Support levels: $54, $52, $50
The intraday movement in Litecoin was not impressive enough. If the LTC/USD improves in the last hours of the day, the intraday traders can expect a positive close. At present, the main cryptocurrencies are under tremendous market pressure. Traders hope for improvement, but it may take some time.
A couple of days ago, LTC/USD started with a trading price of about $62.12 and closed the day with $63.83. Yesterday, the market opened with a rise after which the bears grabbed the price and dragged it below the point where it started trading two days ago. With this fall, the coin might not be able to maintain its effectiveness before showing some signs of downward trends.
Moreover, the intraday movement of the coin is quite unstable with several ups and downs. However, starting at $61.77, a rebound might occur and if the bulls can put more effort one more time, they can push the Litecoin price far above the 9-day and 21-day MA. The potential resistances to watch are $68, $70 and $72 while the supports are $54, $52 and $50 respectively. MACD signal lines are in the positive side giving fade buy signals.
Comparing LTC with BTC, the resistance level of this range is built around 6800 SAT, while the resistance level is set at 7300 SAT because the market price is still moving above the moving averages of 9 and 21 days. Technically, the price might continue a sideways movement within the ascending wedge until the RSI (14) indicator is ready to decide the next direction for the market.
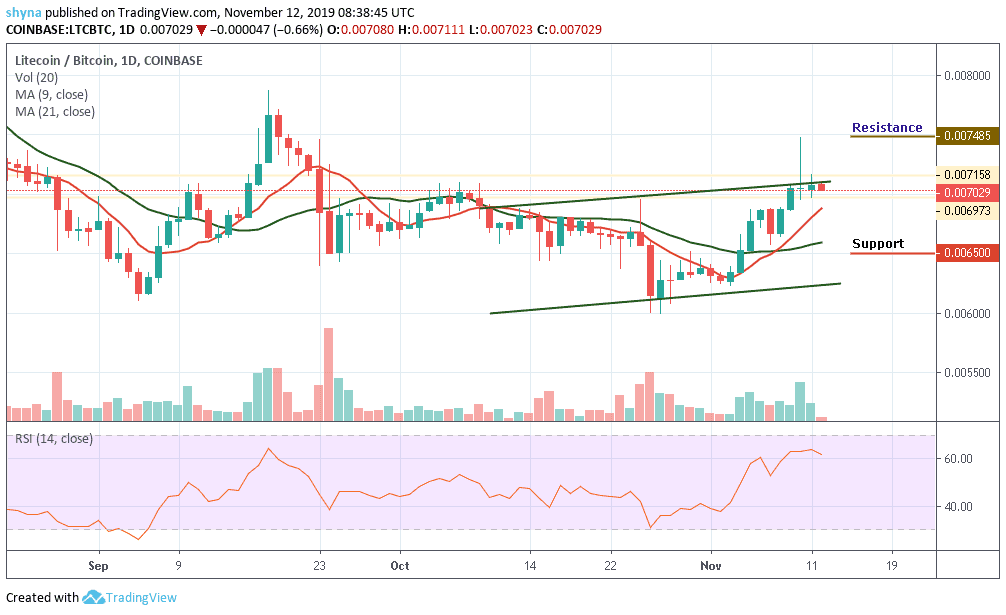
However, should in case the market price continues to move in an uptrend after the decision of the technical indicator, it may likely break out of the channel to reach the resistance levels at 7485 SAT, 7755 SAT and 8000 SAT respectively. Conversely, the market may find support at 6500 SAT, 6200 SAT and 6000 SAT if the bears take control.
Please note: Insidebitcoins.com is not a financial advisor. Do your research before investing your funds in any financial asset or presented product or event. We are not responsible for your investing results.
Join Our Telegram channel to stay up to date on breaking news coverage