Join Our Telegram channel to stay up to date on breaking news coverage
Bitcoin (BTC) Price Prediction – November 11
As of now, Bitcoin (BTC) is aiming to fall again, but the key support is becoming a threat to the bears.
BTC/USD Long-term Trend: Bearish (Daily Chart)
Key levels:
Resistance Levels: $9,600, $9,800, $10,000
Support Levels: $8,000, $7, 800, $7,600
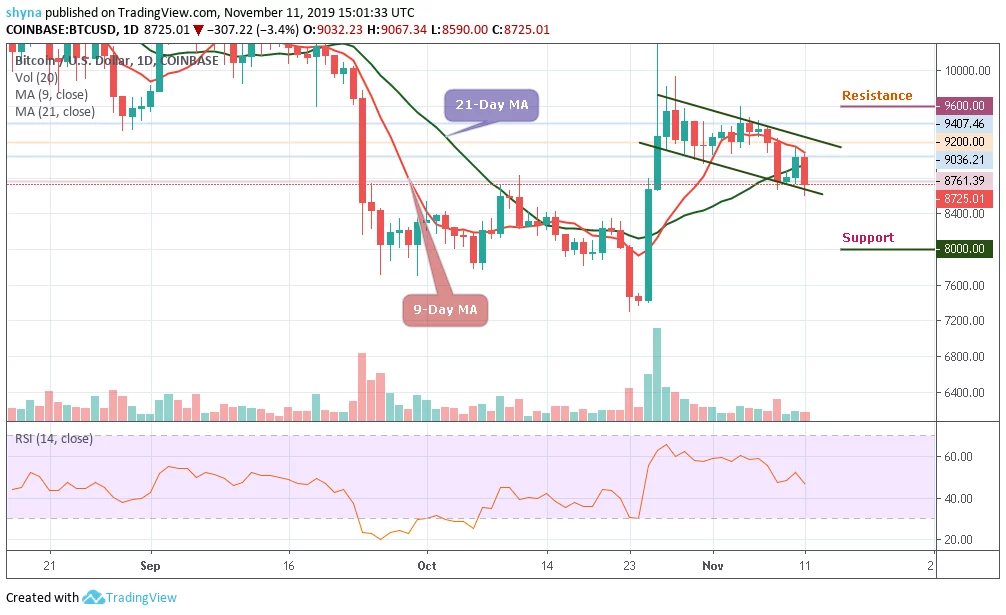
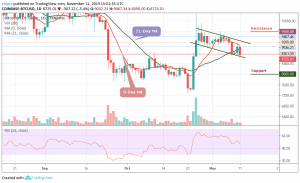
BTC/USD is moving inside a channel pattern on the daily chart. After falling from $9,354 to $8,761 support a few days ago, the coin saw a quick price jump above the 21-day MA and push the market to $9,036. More so, as the market opens today, the bear resume pressure as the price is now facing the $8,500 important support. Once this support breaks, the $8,000, $7,800 and $7,600 support may come into play.
In the opposite direction, if the critical support can continue to provide support for the market, we can expect the price to climb back to $9,200 and $9,400 resistance before we can see a rise above the channel formation to meet $9,600, $9,800 and $10,000 respectively. But as it stands now, BTC/USD is on a downward movement and there’s a high chance for a break than a bounce.
Furthermore, the $8,700 support has continued to bolster well against bearish pressure, but it seems the support is getting weak by the day with two break attempts for the past few weeks. If the price breaks on a third attempt, BTC may leave the critical support level after a significant drop. Meanwhile, the RSI (14) has dropped beneath the 50-level. A further drop may cause the Bitcoin price to fall seriously to the oversold zone.
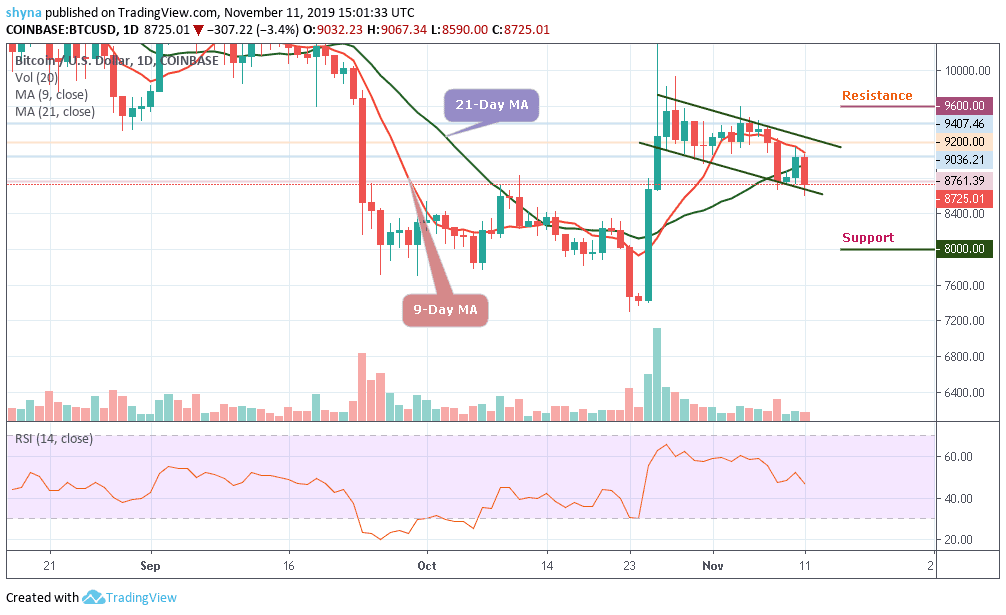
BTC/USD Medium-Term Trend: Ranging (4H Chart)
The Bitcoin price is currently moving around the $8,735 from where the price started falling today at $9,030. Looking at the chart, we can see that the bearish supply has been turning heavy in the market, but the bulls are trying to defend the $8,700 support as well. Meanwhile, the $8,500, $8,300 and $8,100 support levels may come into play if the coin breaks the mentioned support.
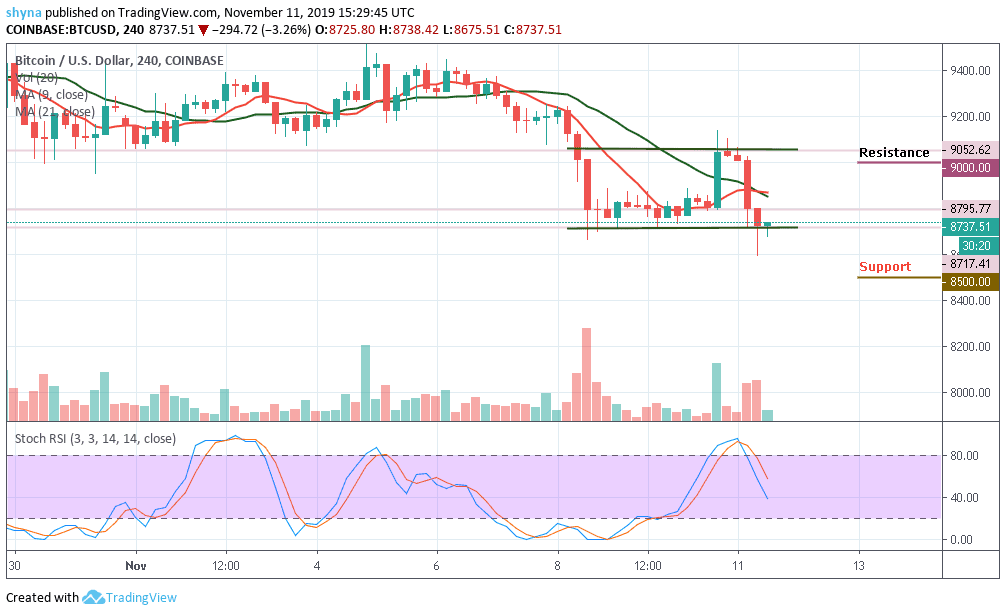
However, if the buyers can reinforce and power the market, we can expect a retest at the $9,000 resistance level. Breaking the mentioned resistance may further allow the bulls to test the $9,200 and $9,400 on the upside. In other words, Bitcoin is currently consolidating and moving sideways on the medium-term outlook. We can expect a surge in volatility to occur as the stochastic RSI faces downtrend.
Please note: Insidebitcoins.com is not a financial advisor. Do your research before investing your funds in any financial asset or presented product or event. We are not responsible for your investing results.
Join Our Telegram channel to stay up to date on breaking news coverage