

Join Our Telegram channel to stay up to date on breaking news coverage
Litecoin (LTC) Price Analysis – July 22
Just as the Litecoin halving is less than a month away; the number four cryptocurrency is starting to show signs of weakness. After peaking at $146 in 2019 on June 22, Litecoin has plunged to a low of $84.88 on July 15th. That’s a drop of over 41% in less than a month.
LTC/USD Market
Key Levels:
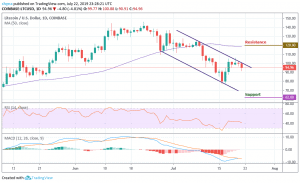
Resistance levels: $120, $125, $130
Support levels: $62, $57, $52

At the time of writing, Litecoin is trading down nearly 5% at its current price of $93, which is down slightly from its 24-hour highs of over $100. While zooming out and looking at Litecoin’s price action over a seven-day trading period, it is clear as to just how much volatility it has been incurring as of late, as it is currently trading up from lows of under $78 that were set when Bitcoin dropped to $9,100 (find out how to buy bitcoin with a debit card here).
Moreover, from above, the nearest level of resistance lies at the $100 level as it contains the 50-day moving average. Above this, higher resistance lies at $110. If the buyers can climb above the $115 resistance, then further resistance lies at $120, $125, and $130. Similarly, from below; the nearest levels of support are $80 and below $80, further support lies at $75 and $70. If the sellers continue beneath $70, the next levels of support are $62, $57 and $52 as both the RSI (14) and MACD are moving at 41 and -6.41 level respectively.
LTC/BTC Market
Comparing with Bitcoin, LTC has fallen lower beneath the support at 0.01 BTC. The LTC/BTC price dropped as low as 0.0089 BTC, LTC subsequently rebounded against BTC and now trades around 0.0092 BTC and trading within the descending wedge under the 50-day moving average.
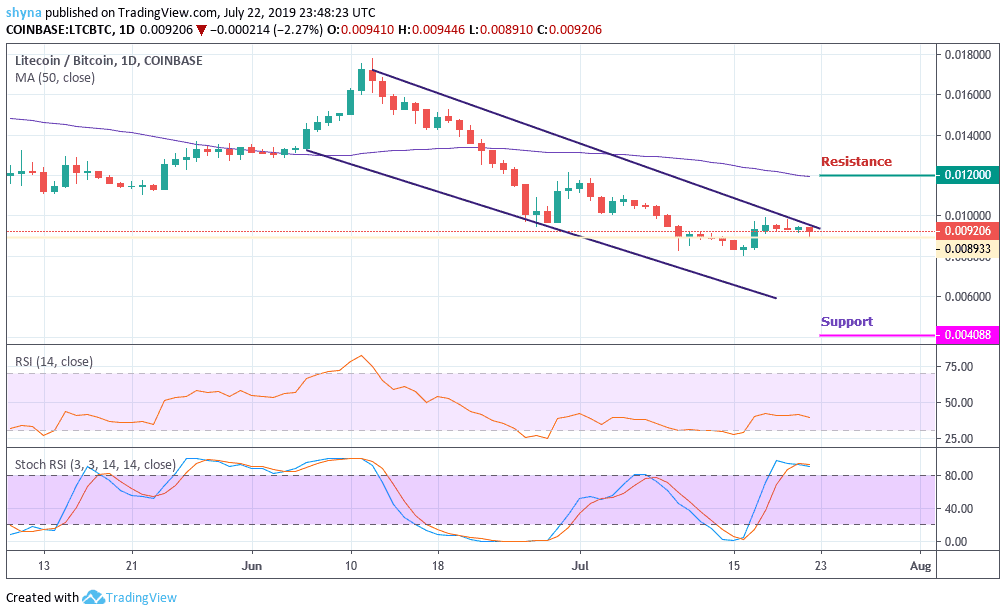
Furthermore, from above, the nearest level of resistance lies at 0.01 BTC. Above this, the next levels of resistance are 0.011 BTC and 0.0115 BTC. If the bulls climb above 0.0115 BTC, higher resistance lies at 0.012 BTC and 0.013 BTC. From below; the nearest levels of support are 0.0060 BTC and 0.0050 BTC. Beneath 0.005 BTC, further support lies at 0.0045 BTC. If the selling creates a fresh 2019 low, lower support is located at 0.0040 BTC and 0.0035 BTC. The RSI moving at the 40 level which shows the market moving in sideways, and the Stochastic RSI has crossed to the overbought zone – a promising sign for the bears.
Please note: insidebitcoins.com is not a financial advisor. Do your own research before investing your funds in any financial asset or presented product or event. We are not responsible for your investing results.
Join Our Telegram channel to stay up to date on breaking news coverage