Join Our Telegram channel to stay up to date on breaking news coverage
Litecoin (LTC) Price Prediction – December 14
The Litecoin (LTC) is looking for support at $75, where the market is likely to provide a rebound level for the coin.
LTC/USD Market
Key Levels:
Resistance levels: $95, $100, $105
Support levels: $65, $60, $55

LTC/USD is currently trading at the support provided by the 9-day and 21-day moving averages. However, a break above this barrier could suggest that the market is headed higher. Still, Litecoin has seen a slight drop of 3.18% in the past 24 hours as the technical indicator RSI (14) is seen dropping below the 55-level.
Would Litecoin Go Down or Up?
As the daily chart reveals, traders can see that LTC/USD is consolidating within the channel. Therefore, if the bulls can hold the price well above the moving averages, we may see a strong uptrend towards the resistance level of $90 and any further bullish movement above the mentioned-resistance level may locate the potential resistance levels of $95, $100, and $105.
However, considering the latest price drop, the market is likely to fall below the moving averages. If the bears put more pressure, we can expect the LTC/USD market to continue its bearish pressure while the critical support is expected at $65, $60, and $55 levels. Although the trading volume remains low as the RSI (14) signal line may be moving in the same direction, indicating an indecisive movement in the market.
Against Bitcoin, the Litecoin price is seen moving slowly within the channel and also remains around the 9-day and 21-day moving averages. Despite the bounce up, the fifth-best performing cryptocurrency is yet to define an actual direction as price actions remained subdued with choppy price actions since the daily opening.
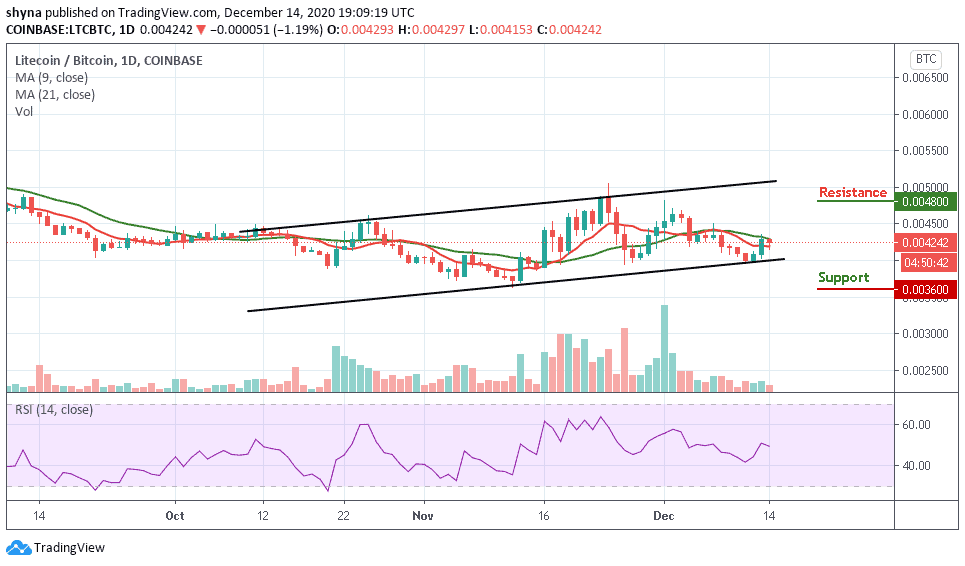
However, the nearest key supports lie at 0.0036 BTC, 0.0034 BTC, and 0.0032 BTC in a subsequent move. Similarly, an upward movement across the moving averages is likely to find immediate resistance at 0.0048 BTC and above. Meanwhile, the RSI (14) is convincingly moving below the 50-level and as it stands now, the bears are likely to gain control of the market.
Join Our Telegram channel to stay up to date on breaking news coverage