Join Our Telegram channel to stay up to date on breaking news coverage
Bitcoin (BTC) Price Prediction – December 14
The Bitcoin price is now trading slightly above the $19,000 level and the moving averages.
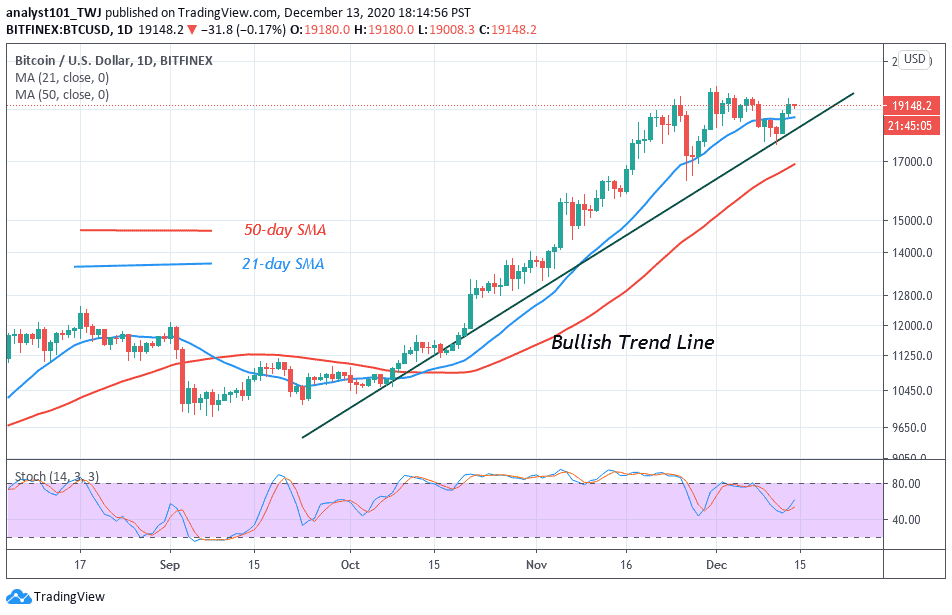
BTC/USD Long-term Trend: Bullish (Daily Chart)
Key levels:
Resistance Levels: $20,500, $20,700, $20,900
Support Levels: $17,400, $17,200, $17,000

BTC/USD is trading in a positive zone above the $19,000 zone. The Bitcoin price is currently hovering around $19,155, suggesting high chances of more upsides above $19,500 but the coin might move sideways before creating higher highs as reveals by the daily chart. Meanwhile, a break above $19,300 could open the doors for more upsides above the $19,450 high.
Would Bitcoin Go Up or Down?
As the downtrend kicks off, the price of Bitcoin is at risk of seeing further losses. If Bitcoin begins a short-term downside correction, it could find support near the $18,800 level or the 9-day and 21-day moving averages. The main support may now be forming near the $18,000 level. Therefore, a proper daily close below this level could lead the price towards the $17,500 support level in the near term as the critical supports are located at $17,400, $17,200, and $17,000.
However, if the bulls can cause the price to remain above the 9-day and 21-day moving averages, moving up further could push the price towards the resistance levels of $20,500, $20,700, and $20,900. Nevertheless, the technical indicator RSI (14) is moving below the 60-level, suggesting a sideways movement.
BTC/USD Medium – Term Trend: Ranging (4H Chart)
According to the 4-hour chart, the fast-moving 9-day MA remains below the slow-moving 21-day MA; the market price is trading within the two moving averages as a sign of bearish momentum. However, in case the current market value of the $19,000 level still holds, the bears may exert pressure to break down the important support level and the price may decline to $18,400 and below.
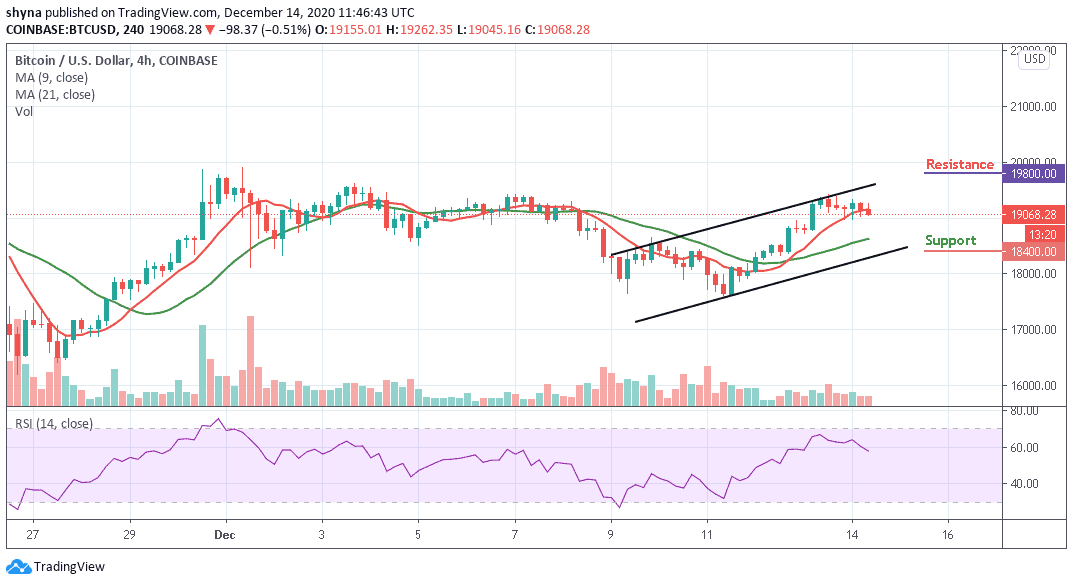
Moreover, should the bulls increase their pressure and push the market price above the 9-day moving average, the resistance level of $19,400 may be penetrated and the price may increase to $19,800 and above. However, the technical indicator RSI (14) is moving below 60-level to indicate a bearish movement.
Join Our Telegram channel to stay up to date on breaking news coverage