Join Our Telegram channel to stay up to date on breaking news coverage
Ethereum’s price gained in the European trading session on Wednesday, along with Bitcoin and other market leaders with respect to market capitalization. The now proof-of-stake (PoS) smart contracts token was up 1.5% on the day to exchange hands at $1,655. Ether’s 24-hour trading volume was also up by 12.96% to stand at $7.90 billion. Its live market cap had crossed the $200 billion mark to $202,528,063,608 at the time of writing.
Other top 10 cryptos by market value were also flashing green with the big crypto Bitcoin (BTC) rising 1.45% over the last 24 hours to trade at $23,747, according to data from CoinMarketCap. The largest cryptocurrency by market capitalization has lost 1.73%over the last week.
Top 10 Cryptos By Market Value
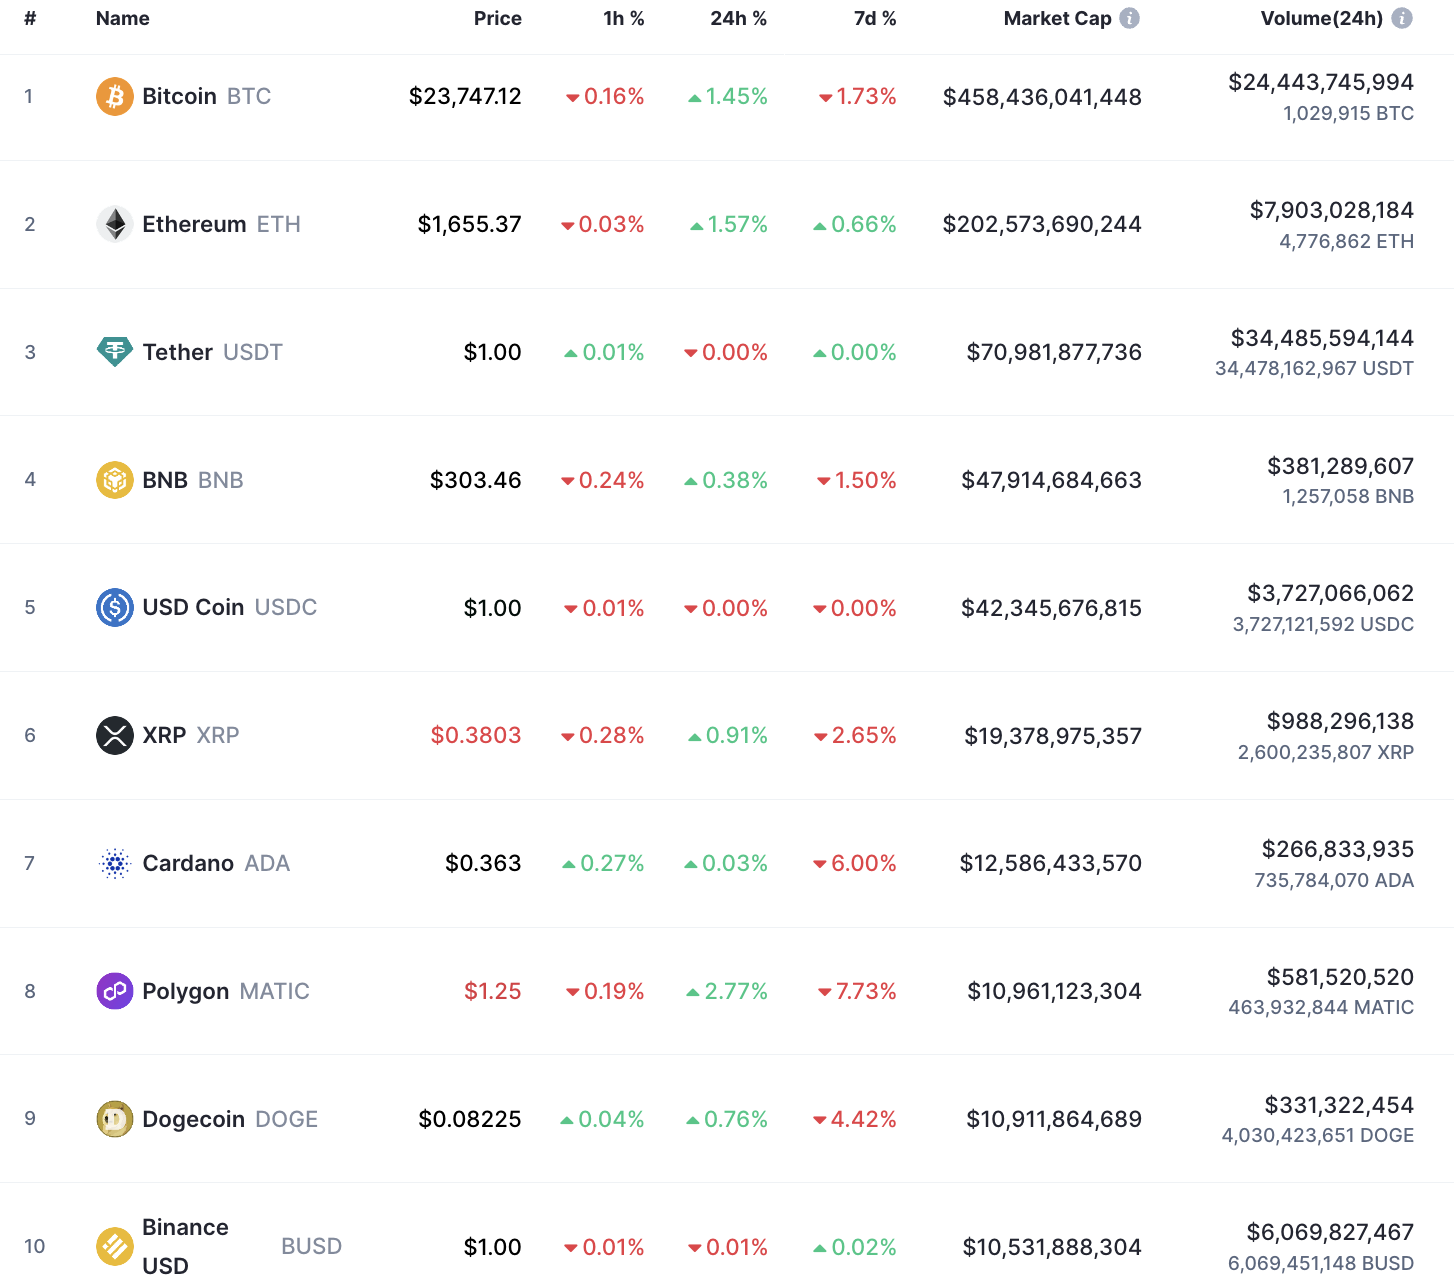
Polygon (MATIC) gained the most among the top 10 cryptocurrencies, rising 2.77% to $1.25, but declined 7.73% on the week. Cardano’s ADA was the least gainer, rising a mere 0.38% on the day to trade just above $0.360.
The European stock market started the month of March in the green, driven by the positive manufacturing data from China, in spite of another rate hike expected from the European Central Bank (ECB) this month. France’s STOXX 600 gained 0.8% while Germany’s DAX 40 inched up 0.3%.
Despite these gains across the finance and crypto markets, investment management firm Morgan Stanley has warned that the ongoing rally in the stock market could be a “bull trap”. The Investment management giant also said that “March is a high-risk month for the bear market to resume.”
Ethereum Bulls Eye 8.8% Gains To $1800
Ethereum price embarked on an uptrend after finding support from the 50-day Simple Moving Average (SMA). This support was being defended for the second time in a month as the token exchanged hands at $1,655. According to technical analysis on the daily timeframe, the run-up has the potential to carry on to $1,790 and perhaps to the $1,800 psychological level before retracing again sharply.
The daily chart illustrated below sheds light on a vivid bullish picture for ETH. First, increasing buying pressure came into play when the declines retested the 50-day SMA at $1,575. This gave late investors an opportunity to enter into the PoS token; thus creating enough demand for a sharp recovery.
Patient traders are likely to be rewarded as Ethereum’s price lifts toward $1,790 and $1,800 (levels last seen in September 2022). This would represent an 8.18% uptick from the current price.
However, to affirm the V-shaped recovery, Ether must close the day above two critical levels; the immediate resistance reinforced by the $1,700 psychological level and the barrier at $1,742, as highlighted by the technical formation’s neckline.
ETH/USD Daily Chart
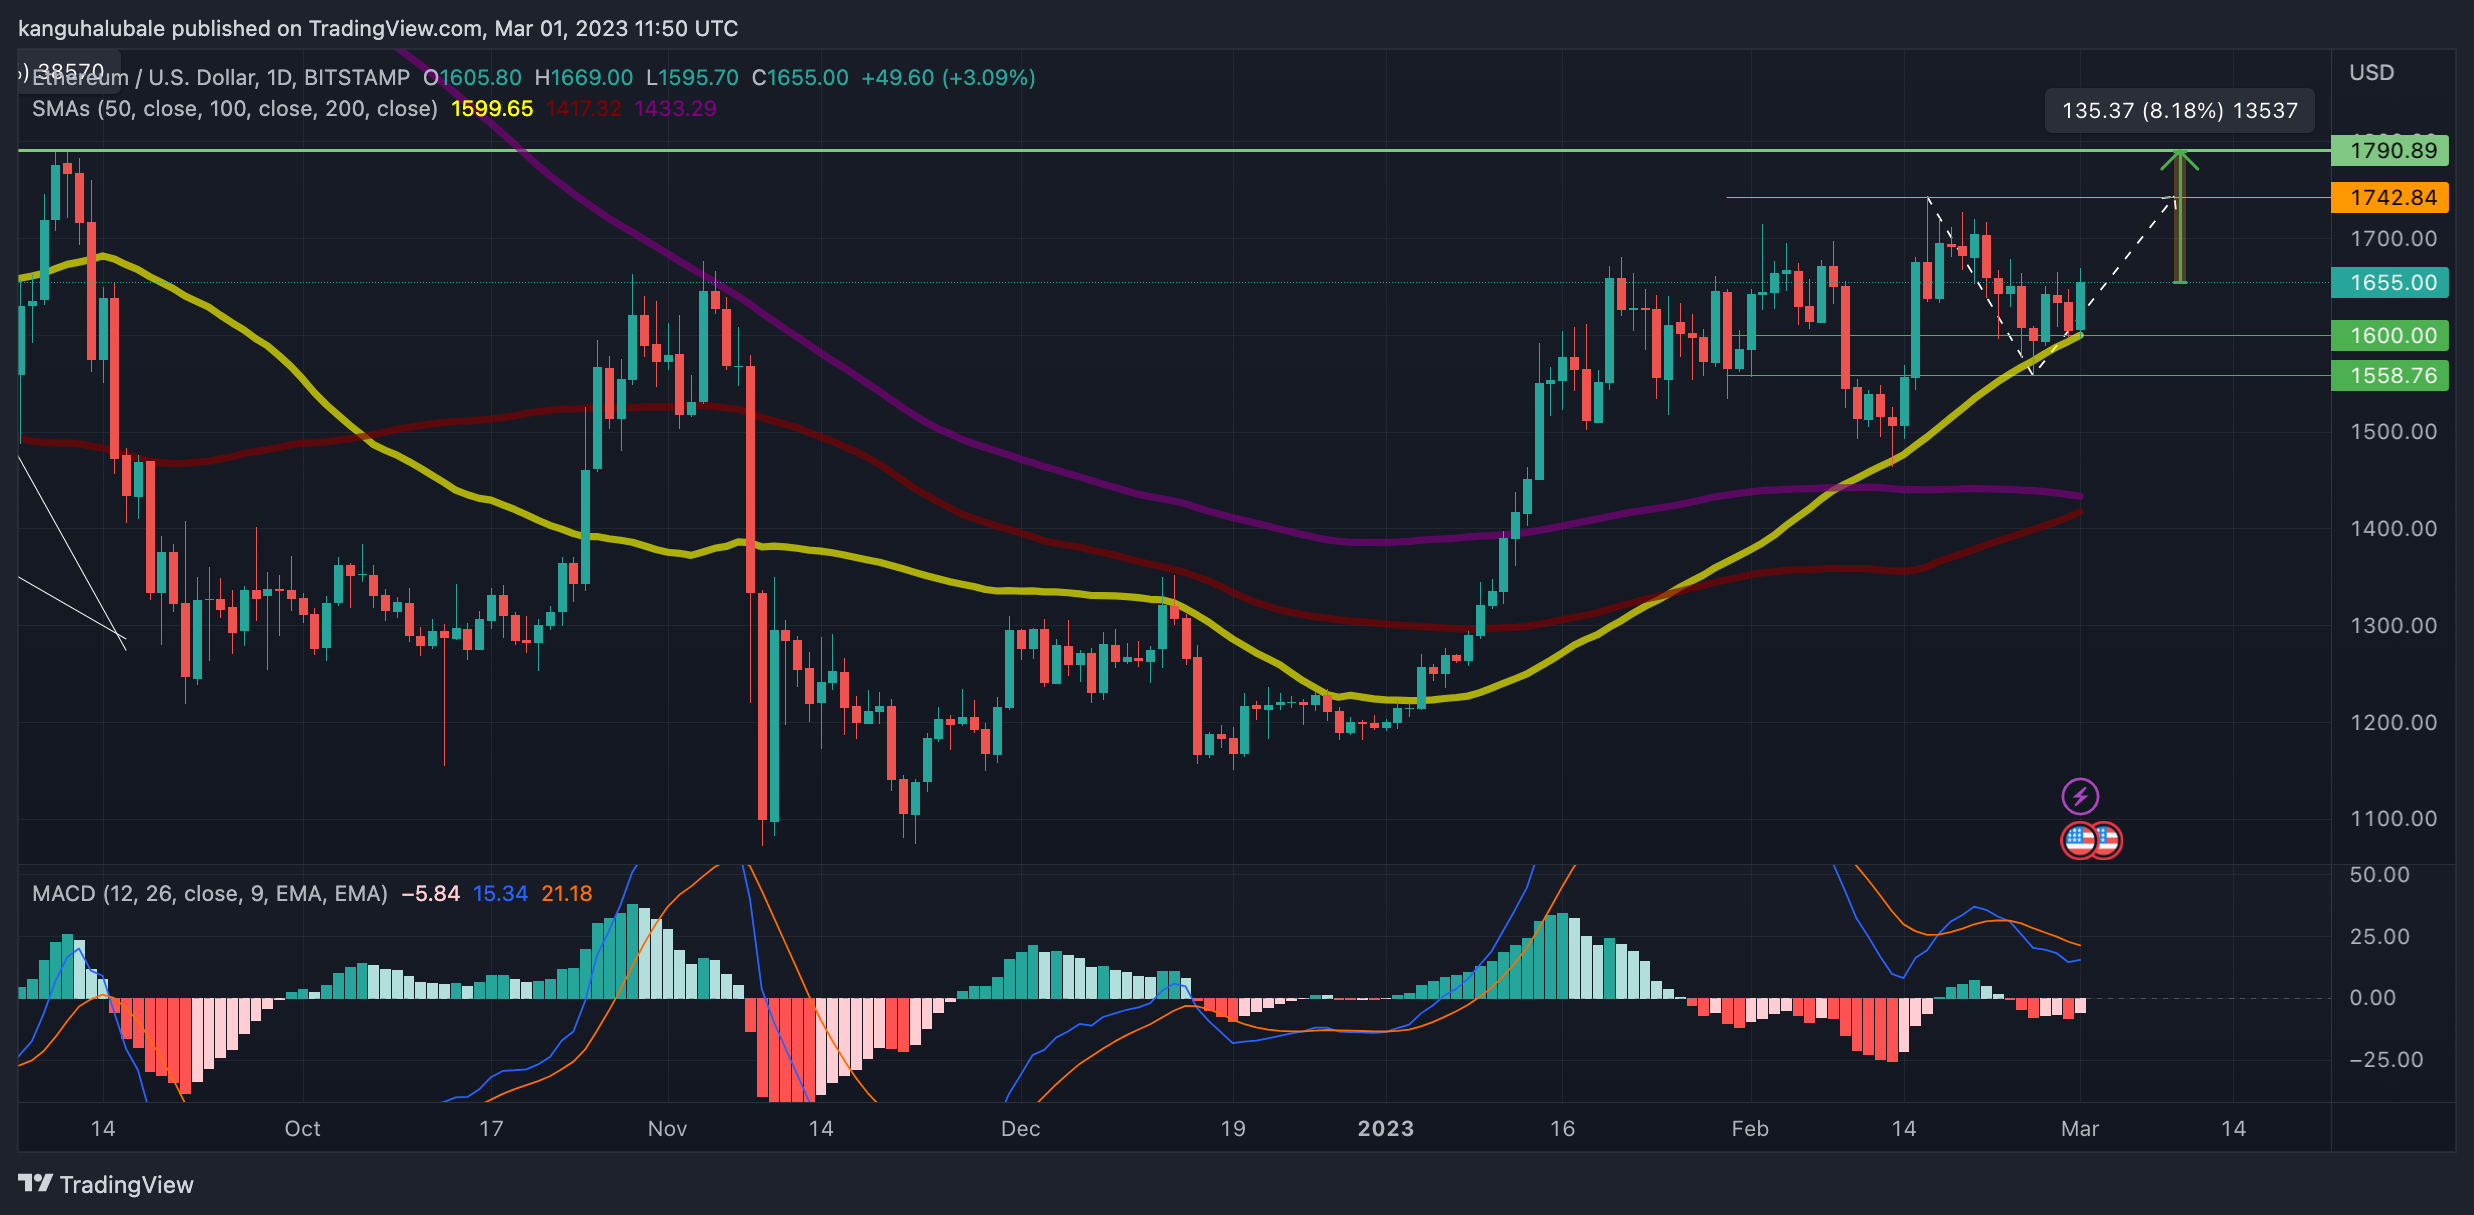
The “golden cross” marked at the beginning of February with the 50-day SMA lifting above the 200-day SMA was still in play. Meanwhile, the pending bullish cross from the 100-day SMA suggests that Ethereum’s price uptrend may remain intact in the coming sessions.
In addition, the Moving Average Convergence Divergence (MACD) indicator was moving in the positive region above the neutral line. This suggested that the market still favored the buyers. Traders should also watch out for the movement of the MACD line (blue) above the signal line (orange) to ascertain the recovery’s potential and avoid bull traps.
Also validating Ether’s recovery stint is the Parabolic Stop and Reverse (SAR) indicator, which has flipped to trail Ethereum’s price in mid-February. As long as the parabolas hold below the token, the slightest resistance path would remain to the north. Note that the wider spaces between the parabolas indicate stronger momentum.
ETH/USD Daily Chart
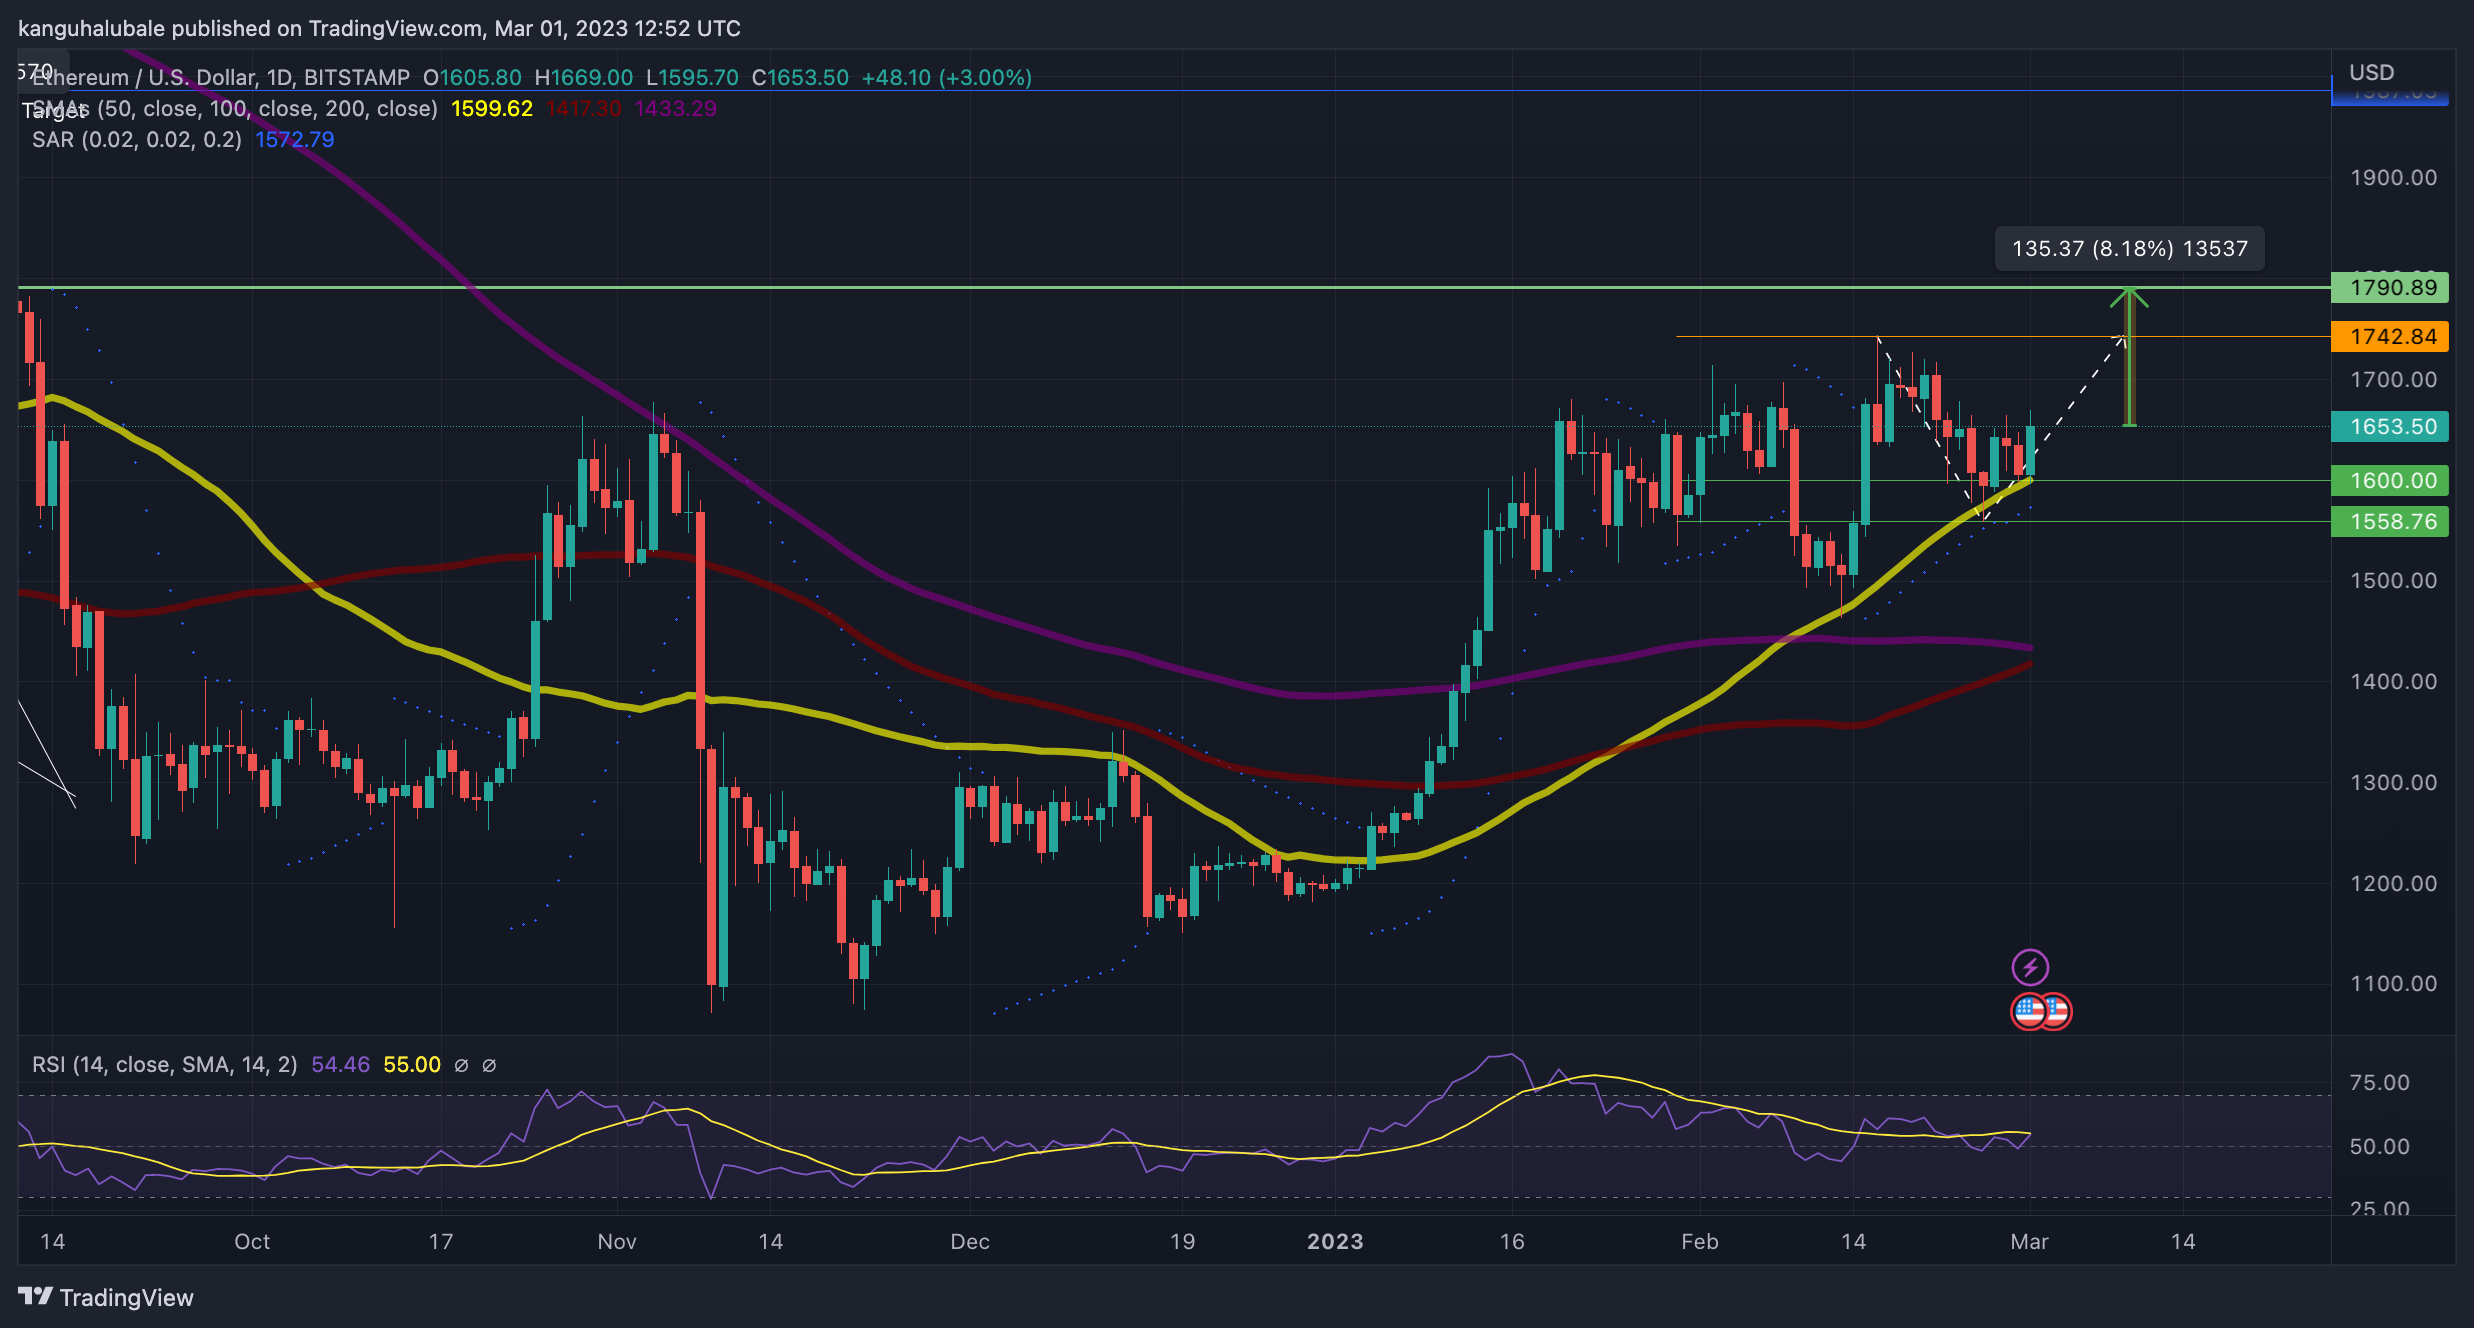
Furthermore, the Relative Strength Index (RSI) was moving upward away from the middle line. The price strength at 54 suggested that the bulls had begun returning to the market, adding credence to the bullish outlook.
On the downside, the inability of the buyers to sustain the recovery would see ETH turn down from the current levels. Therefore, a daily candlestick close below the $1,600 support level, embraced by the 50-day SMA, could trigger massive sell orders that could see the largest altcoin drop to the shape’s low at $1,558, invalidating the bullish narrative.
ETH Alternatives
The technical analysis above points to a positively rated ETH with a potential of posting 8% gains in the near term. Some value-driven altcoins, however, have the chance to provide better rewards if investors become early adopters because these cryptos are still in the presale stage.
CCHG, the native token of the eco-friendly crypto startup C+Charge, is one such token. C+Charge is a peer-to-peer payments platform that allows electric vehicle (EV) drivers to pay for electric charges while earning carbon credit incentives.
C+Charge is currently in the fourth stage of its presale, with nearly $2 million raised so far.
⚡🤯BREAKING NEWS
What an excellent week for C+Charge⭐️
🏅WE HAVE REACHED STAGE 5 WITH NEARLY $2 MILLION RAISED🏅
Current price: 1 $CCHG = $0.018
Hurry up before the price increases again!💸
Join our #presale now⬇️https://t.co/ixe18bPqzI#ReFi #Cryptocurrecy pic.twitter.com/XSdMSHNYZY
— C+Charge (@C_Charge_Token) March 1, 2023
Visit C+Charge here before March 29 to buy your CCGH before the prices go up
Read More:
- Gifto (GFT) Price Prediction: Gifto in Consolidation Phase as Curve Dao and BNX Continue the Surge in Value
- FIL Price prediction: Filecoin is up 27.4% Is it Time to Invest?
- How to Buy Cryptocurrencies
Best Wallet - Diversify Your Crypto Portfolio
- Easy to Use, Feature-Driven Crypto Wallet
- Get Early Access to Upcoming Token ICOs
- Multi-Chain, Multi-Wallet, Non-Custodial
- Now On App Store, Google Play
- Stake To Earn Native Token $BEST
- 250,000+ Monthly Active Users
Join Our Telegram channel to stay up to date on breaking news coverage
